Diagram
The Copilot4DevOps Diagram Feature allows users to generate, modify, and publish diagrams, including connected and sub-diagrams, thereby improving clarity and decision-making in project management. The Copilot4DevOps Diagram Feature provides a comprehensive tool set for generating, modifying, and managing diagrams within Azure DevOps. By facilitating the creation of connected and sub-diagrams, this feature enhances productivity and collaboration, enabling users to visualize complex workflows effectively.
Accessing the Diagram Feature in Copilot4DevOps
1. Users can access the Diagram feature from the Copilot4DevOps main page by clicking on the Diagram tile.

2. This opens the Diagram interface with two initial tabs: "Prompt" and "Diagram, and a History Panel to access previously generated diagrams while the user is on any of the tabs.

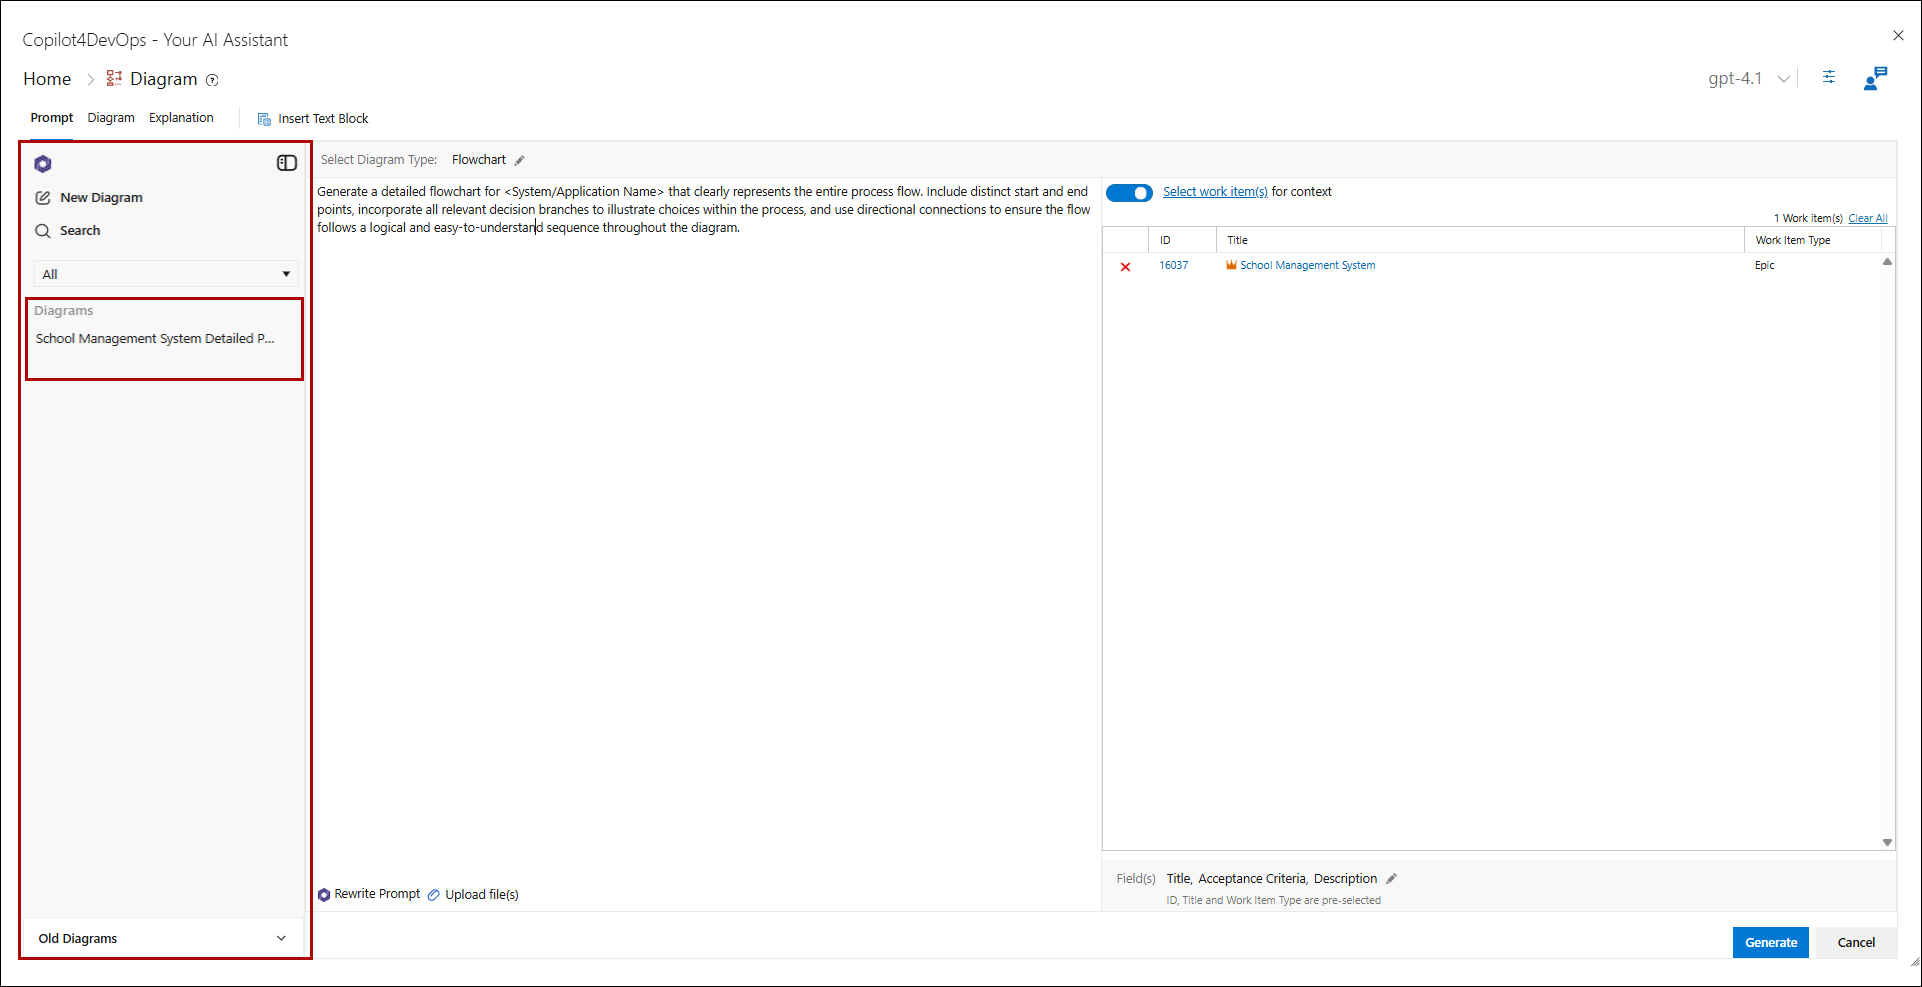
Prompt Tab UI
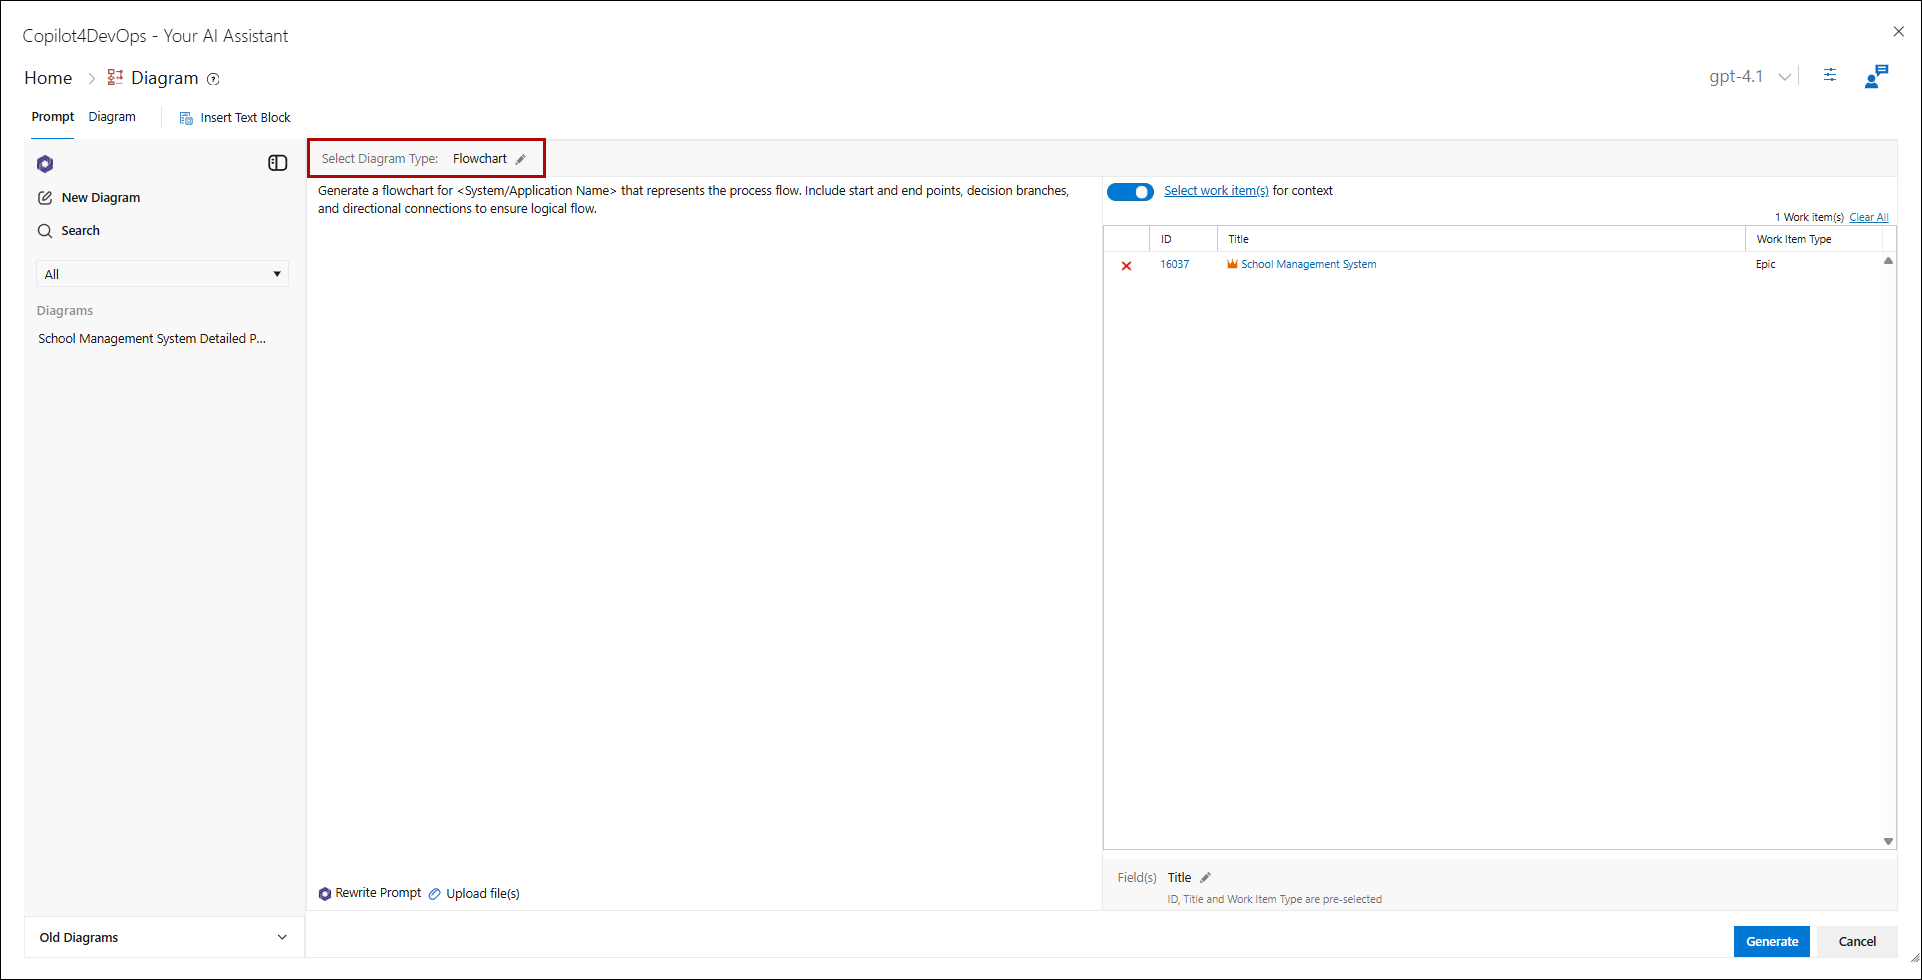
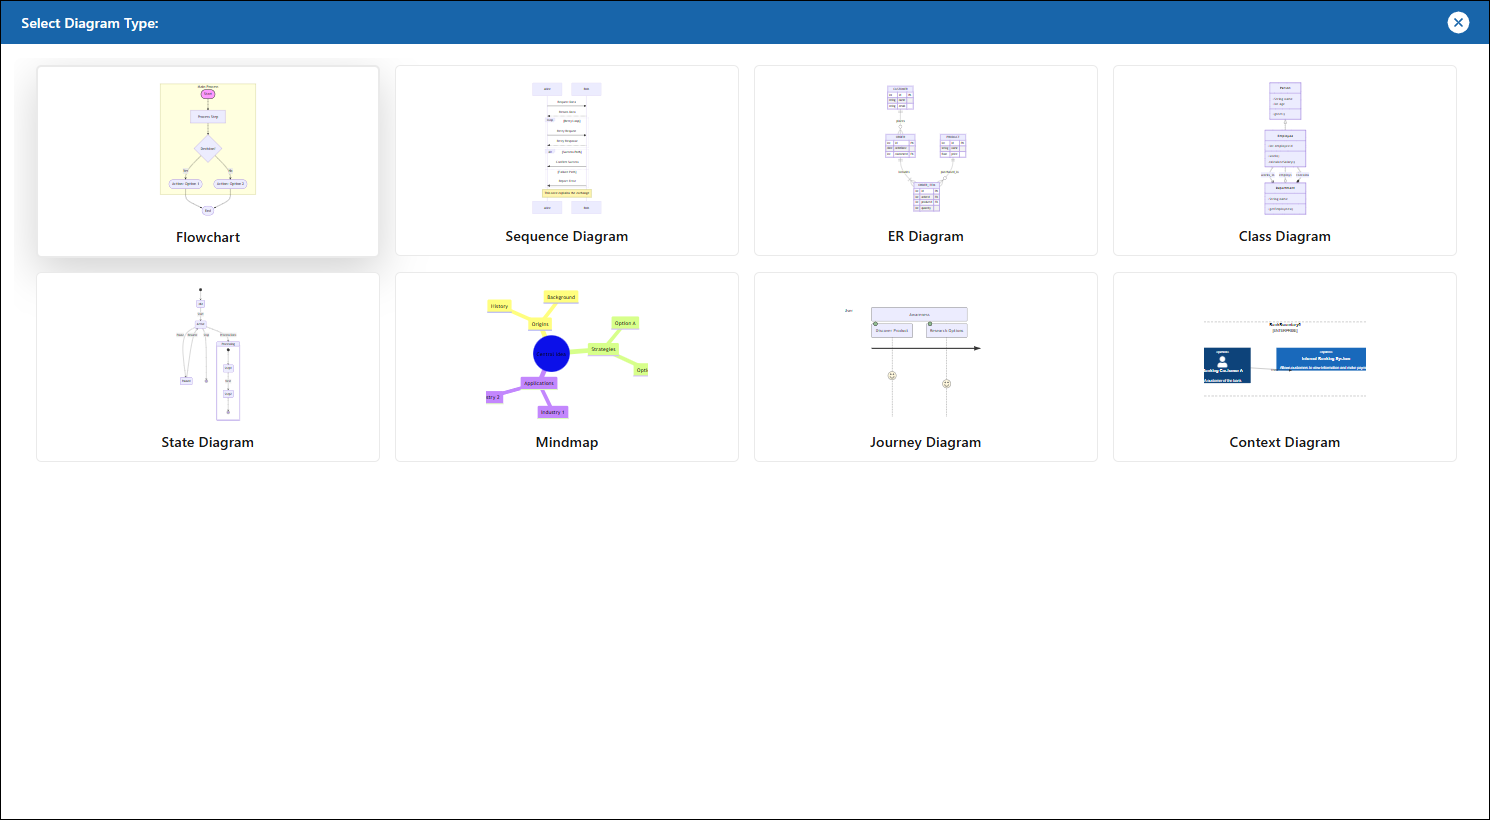
Select Diagram Type
• Users can select a diagram type from the option labeled "Select Diagram Type". By default, "Flowchart" is selected, which generates diagrams based on the user's prompt or selected work item (WI) context.
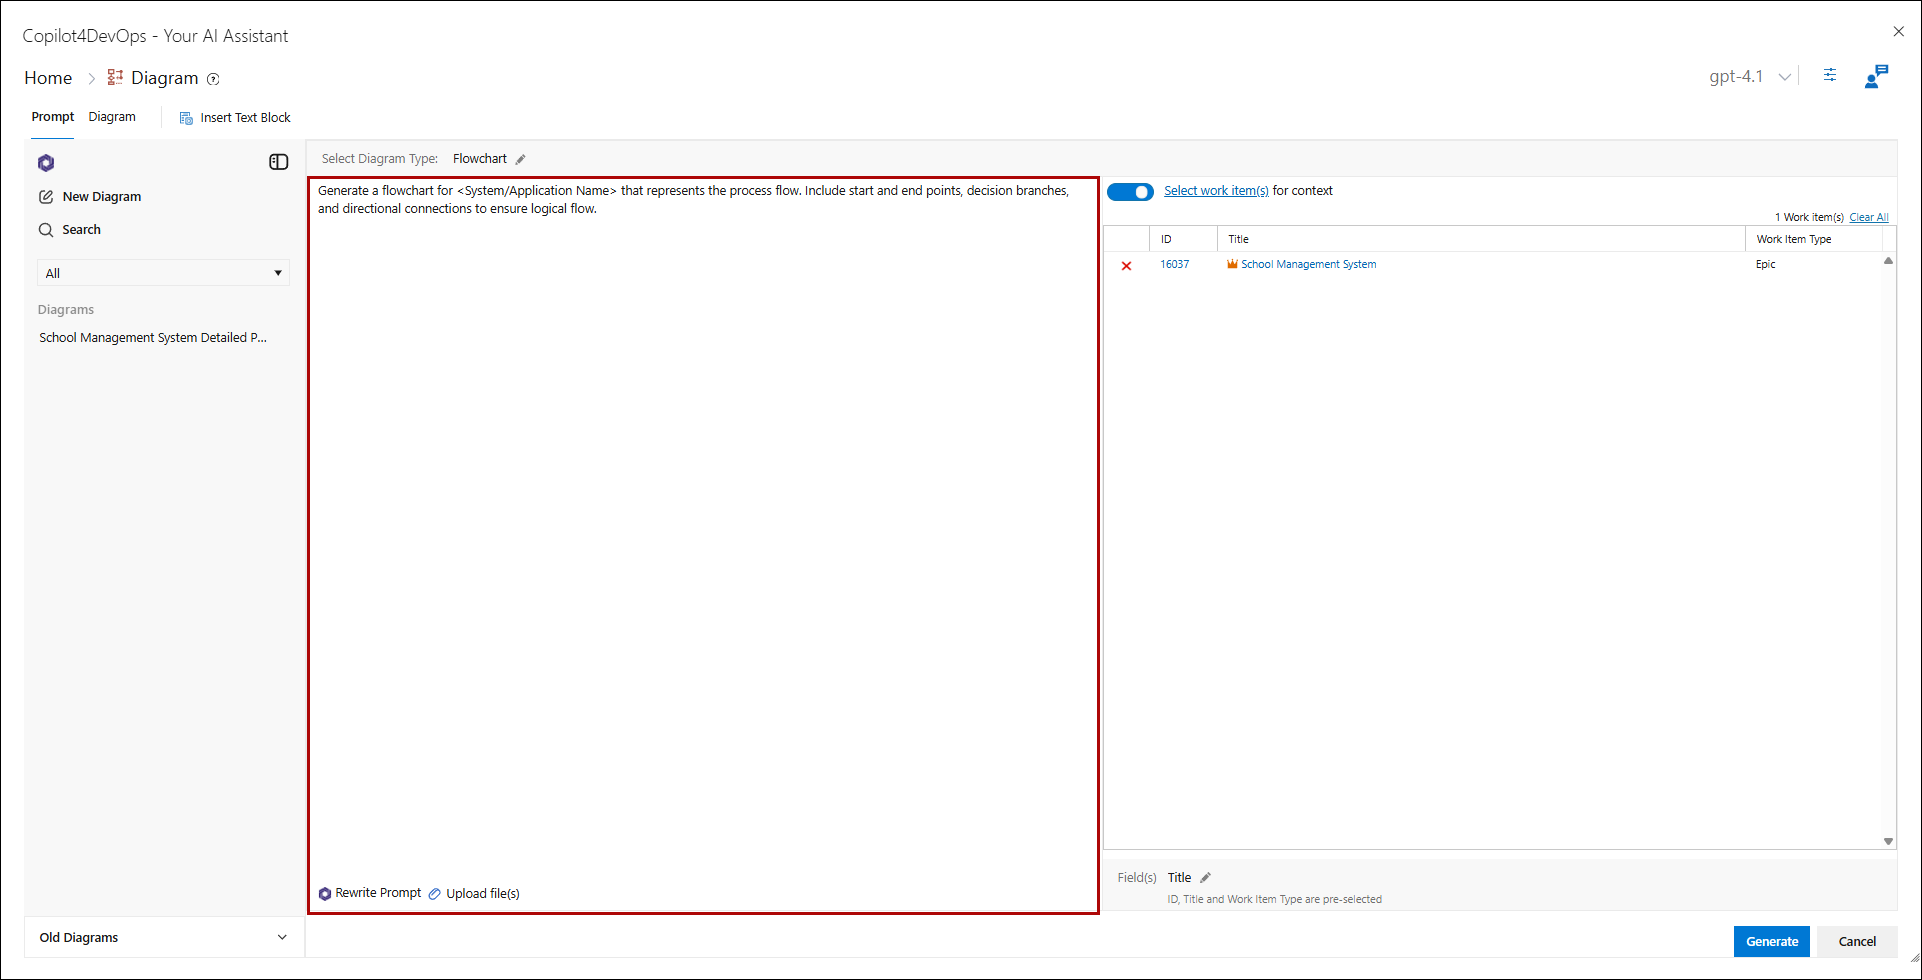
Prompt
• User can enter the prompt on the details of the diagram they want in the left panel.
Contextual Work Items & Prompt
• Users can select work items for context, which will influence the generated diagram. The interface allows for selecting work items by ID or title, and users can choose specific fields to include.

Note: The Fields in the bottom of the right panel will be selected by default in accordance to the work item type. Moreover, ID, Title, and Work Item Type are pre-selected fields which cannot be removed.
Diagram Tab UI
• With the "Chat with Diagram" panel users can explore and rebuild their diagrams, add nodes and connections, and any other modification with a lot of ease.

• The generated diagram is displayed in the center of the Diagram tab.
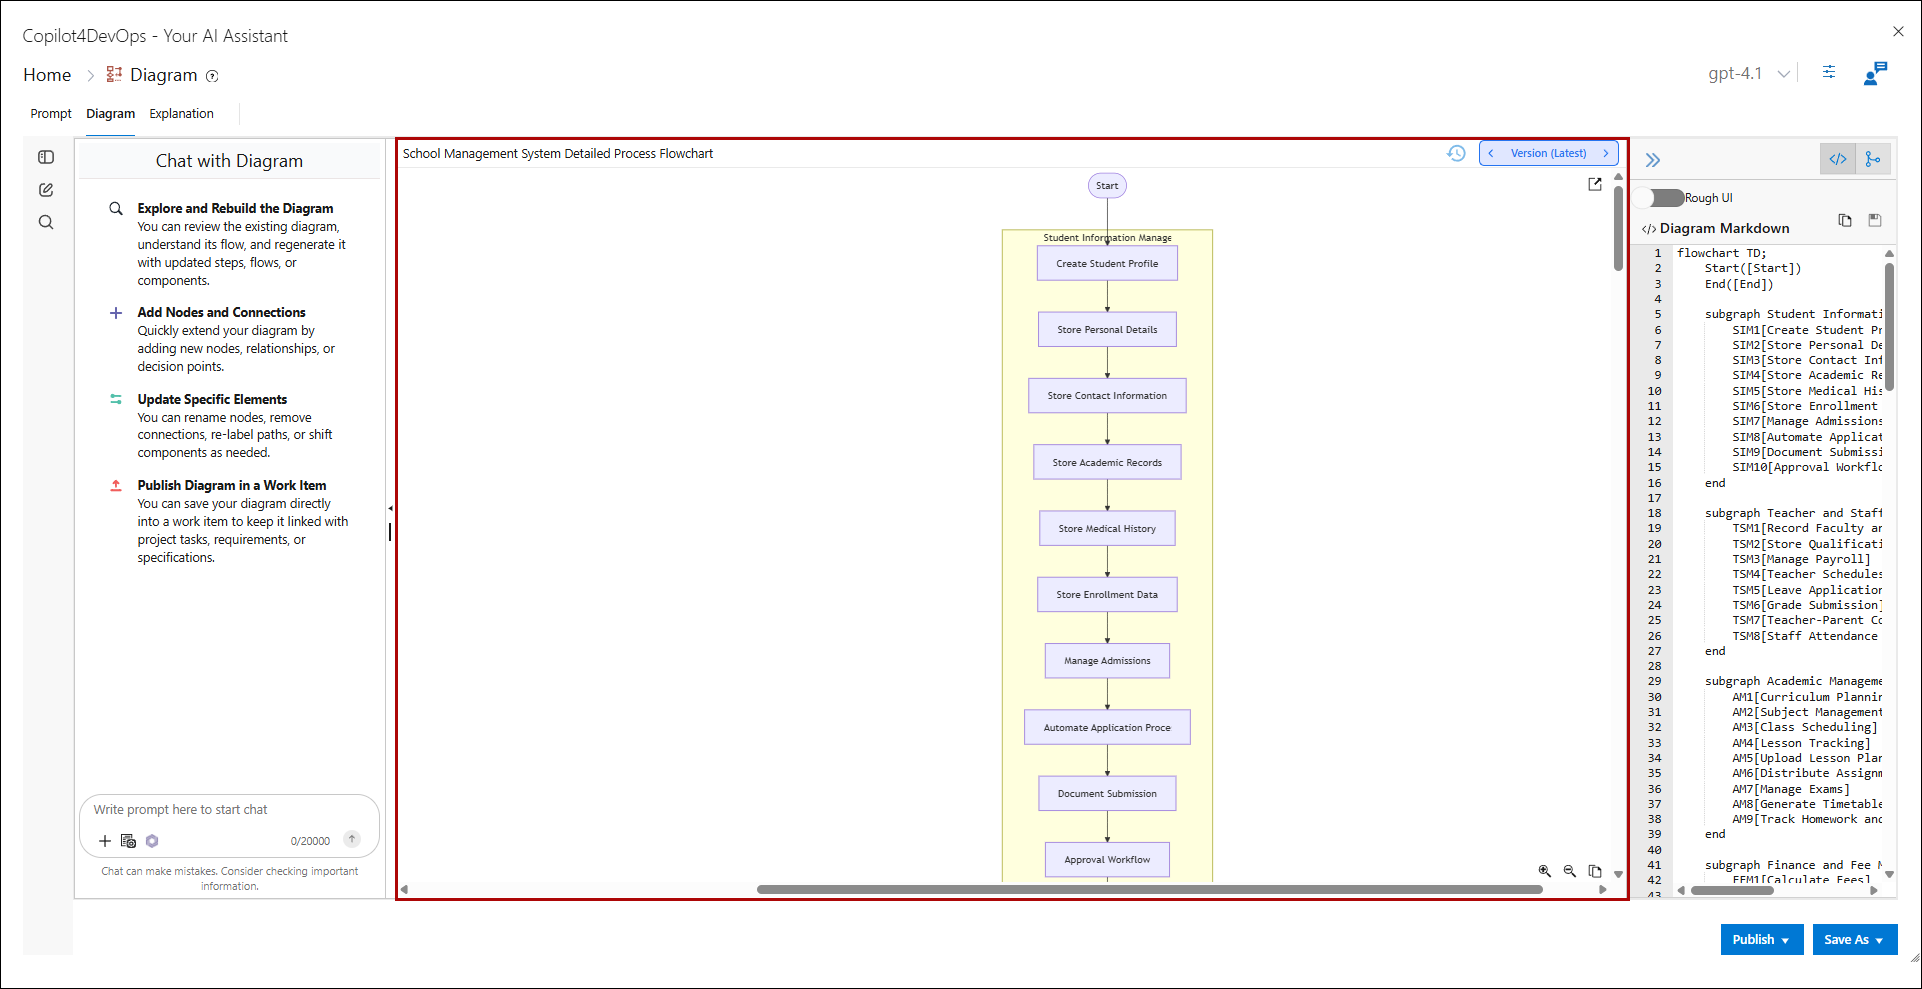
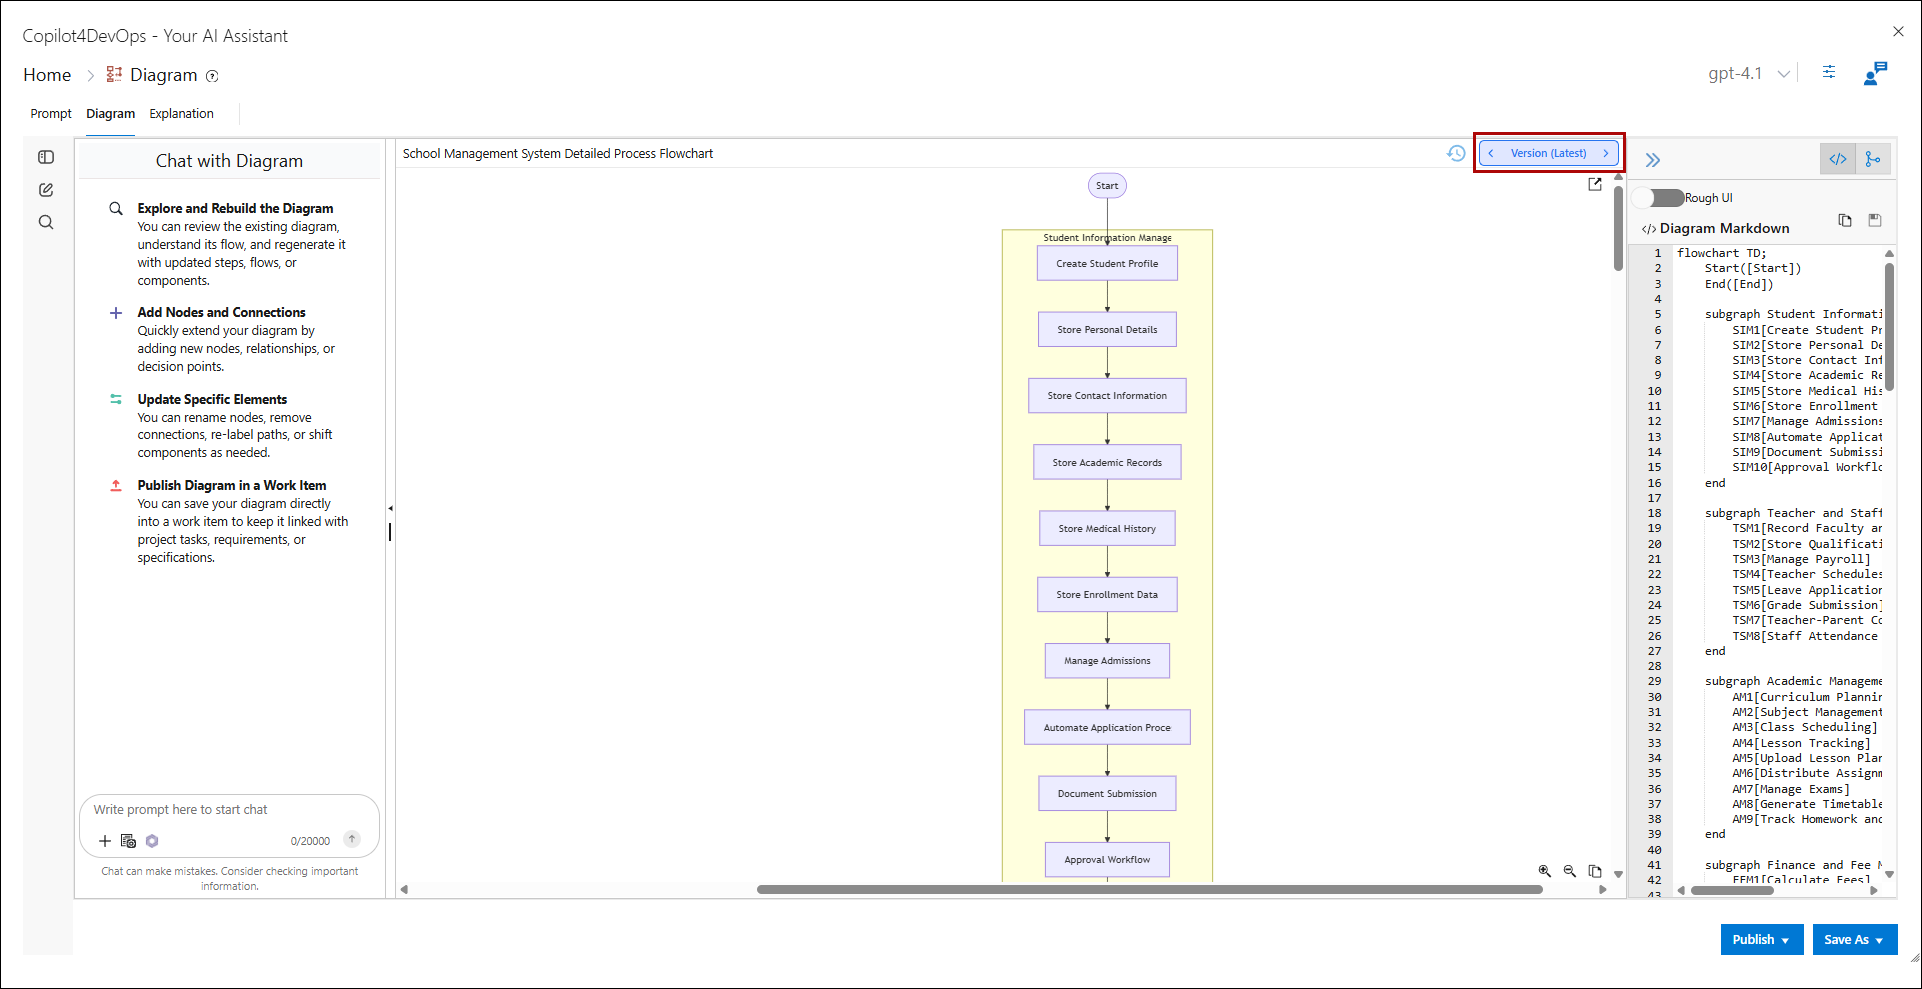
• With every modification or update to the diagram, the Diagram feature registers a new version and users can go back and forth to previous and new versions using the version management option.
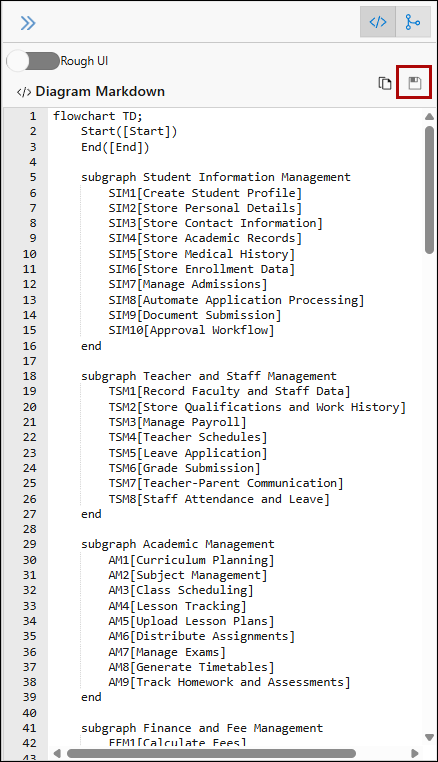
• On the right side of the Diagram tab, there is a Diagram Markdown panel. Users can use this panel to modify the diagram using the Mermaid Code.
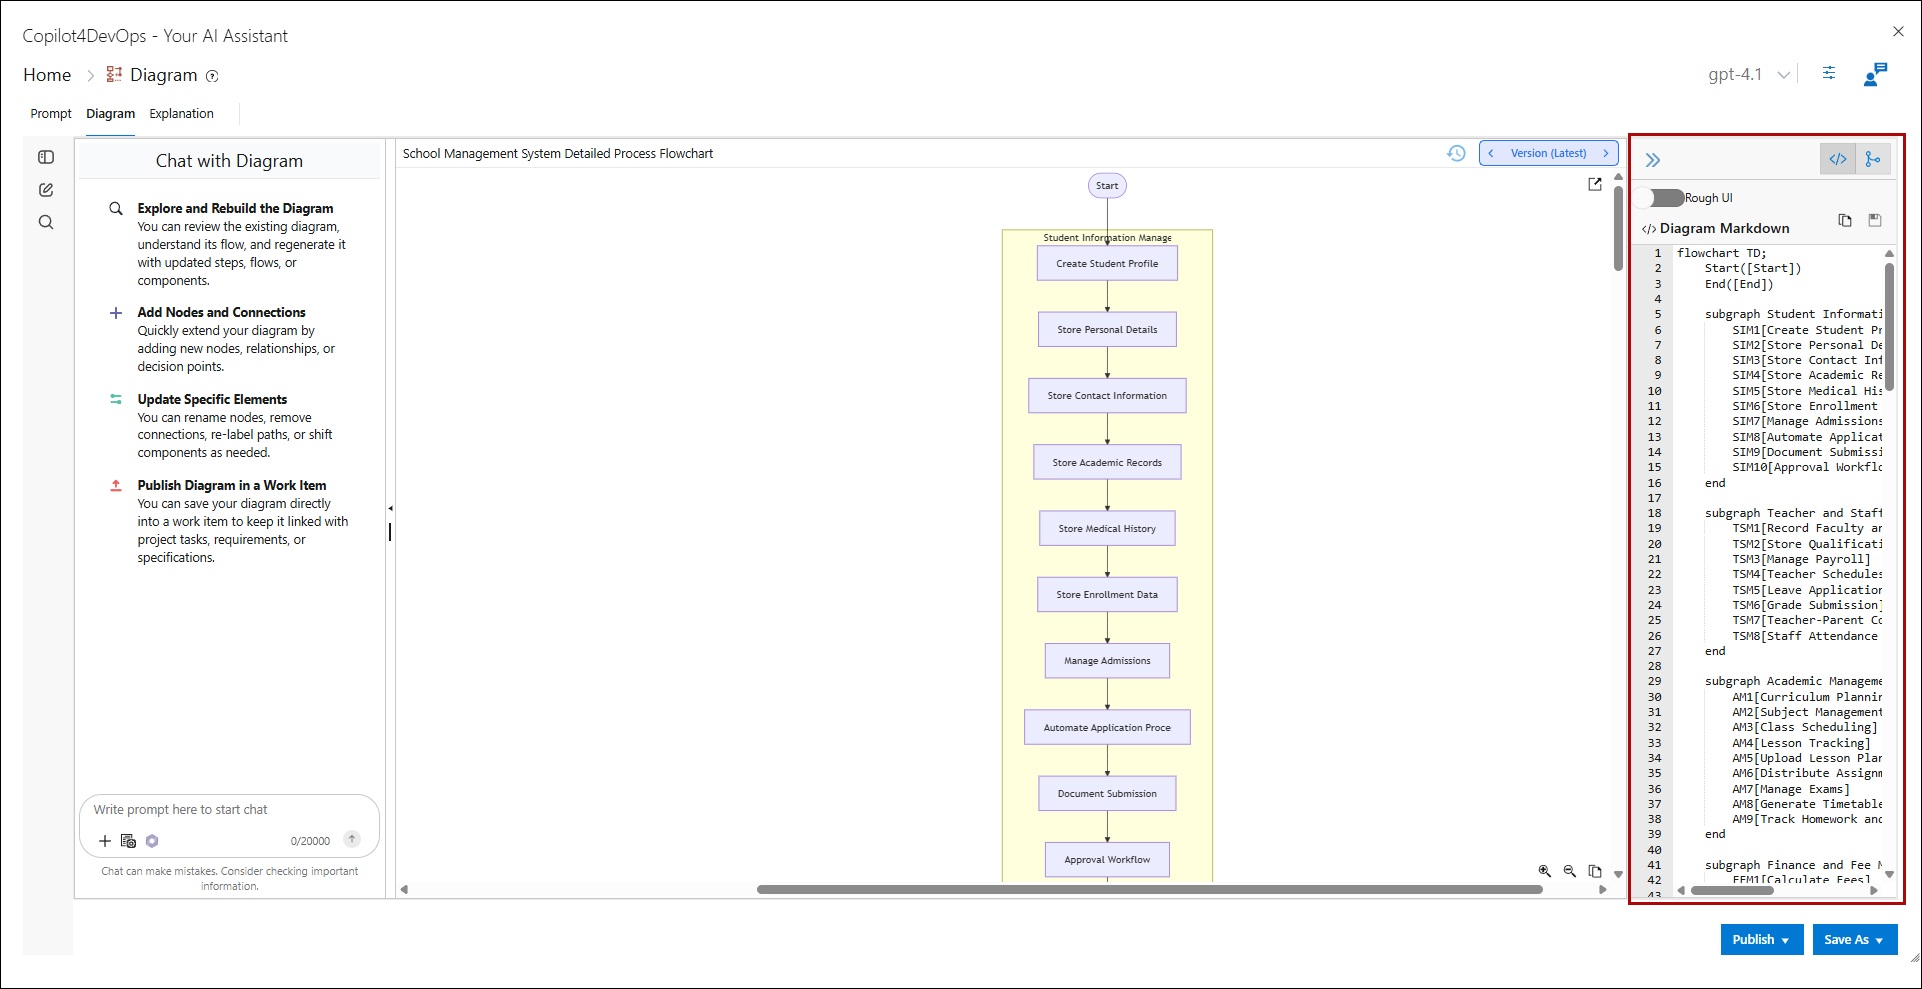
• The following option makes version update using the Diagram Markdown.
Explanation UI
Note: The explanation tab is visible only when a diagram has been generated by the user.
• In the Explanation tab, users can generate and view the explanation for their diagram.
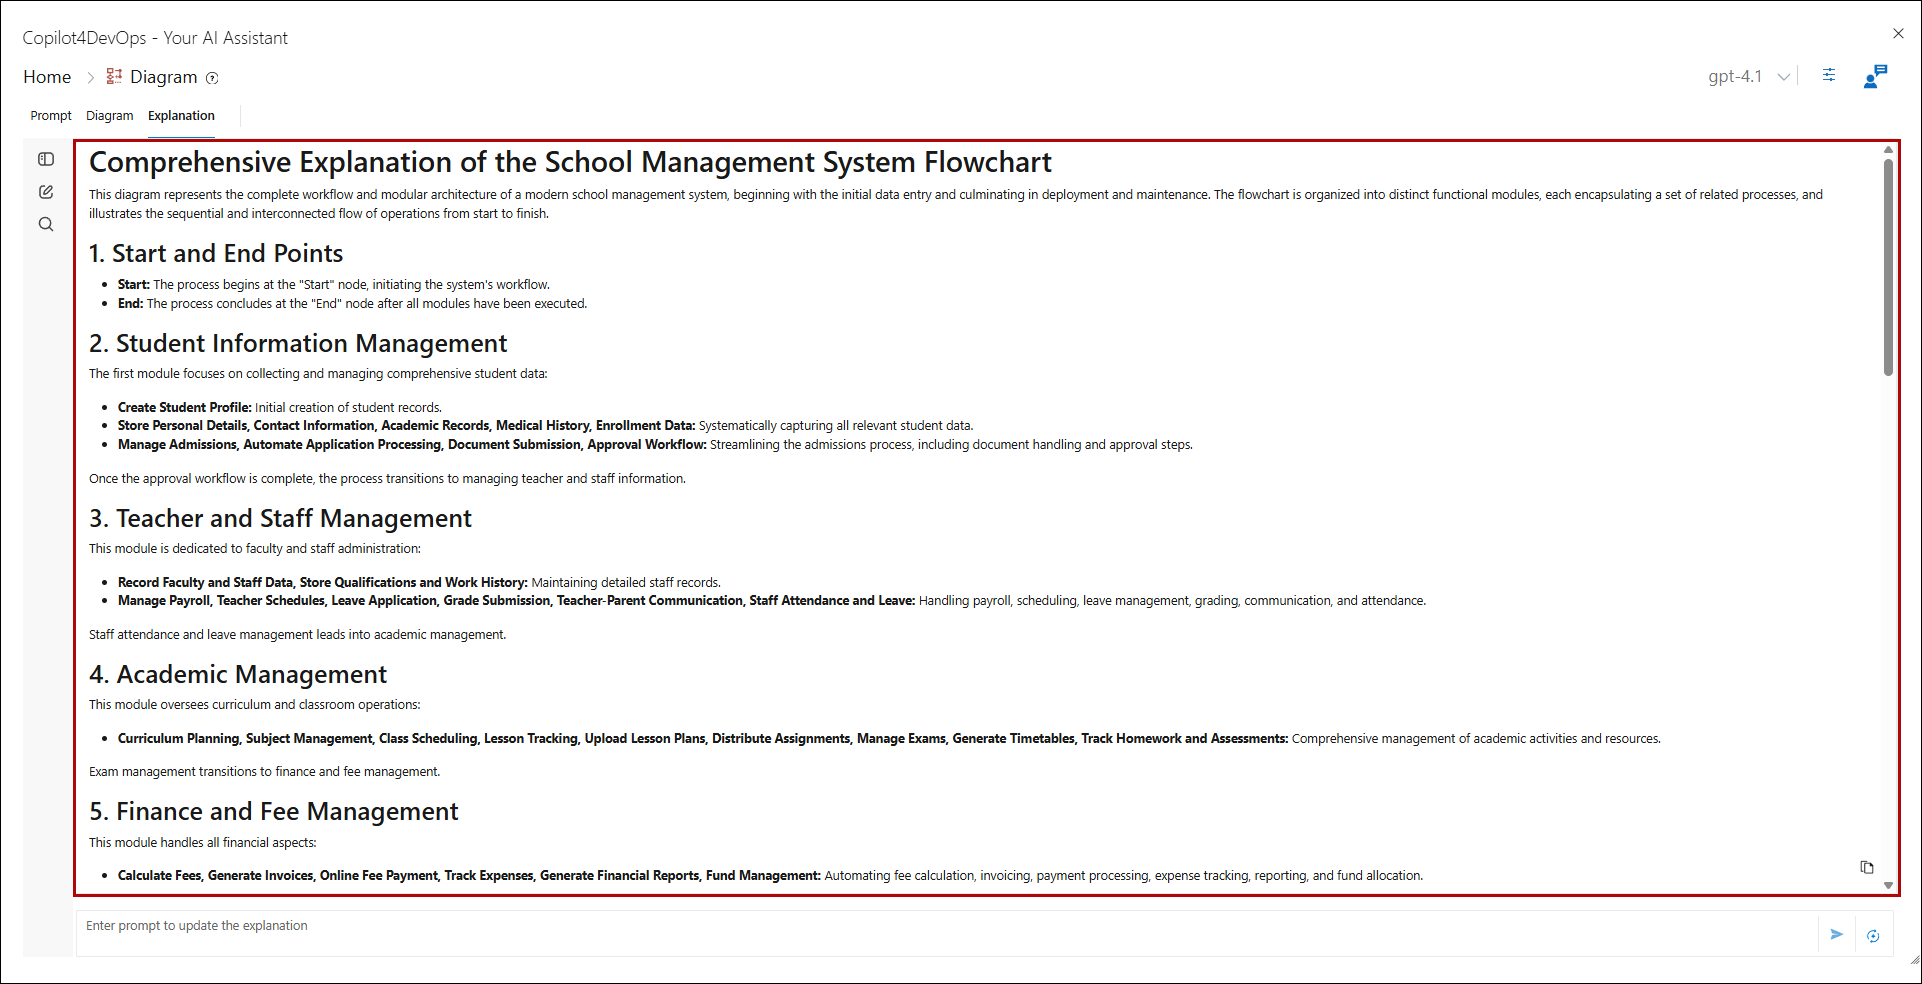
• With the Prompt option at the bottom, users can enter a prompt to update the explanation for the diagram.

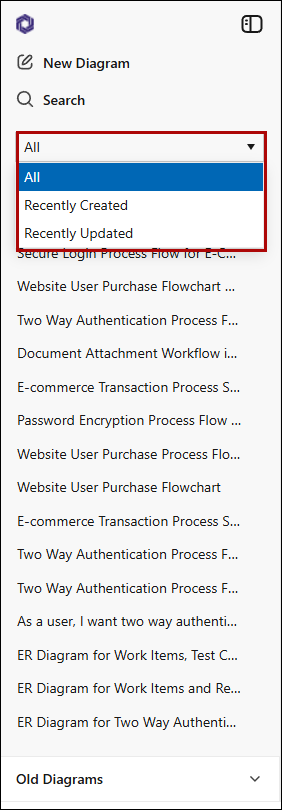
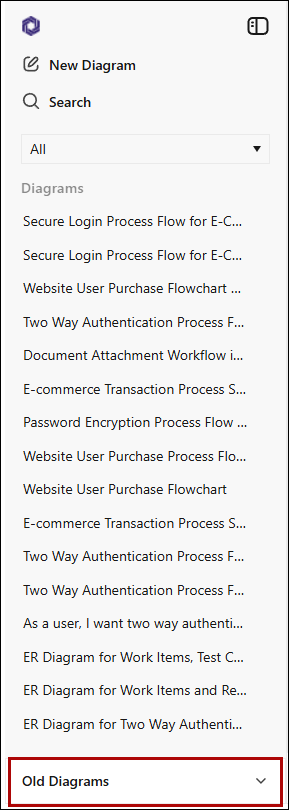
History Panel UI
• History Panel sidebar is accessible in both Prompt and the Diagram tab. At any point of time users can access any previously generated diagram without any hassle.
• Users can access their desired diagrams from the history panel using the filters.
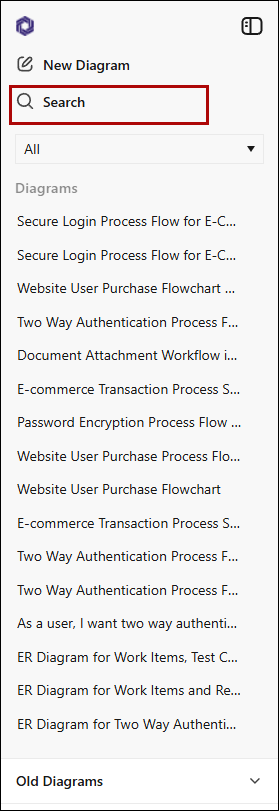
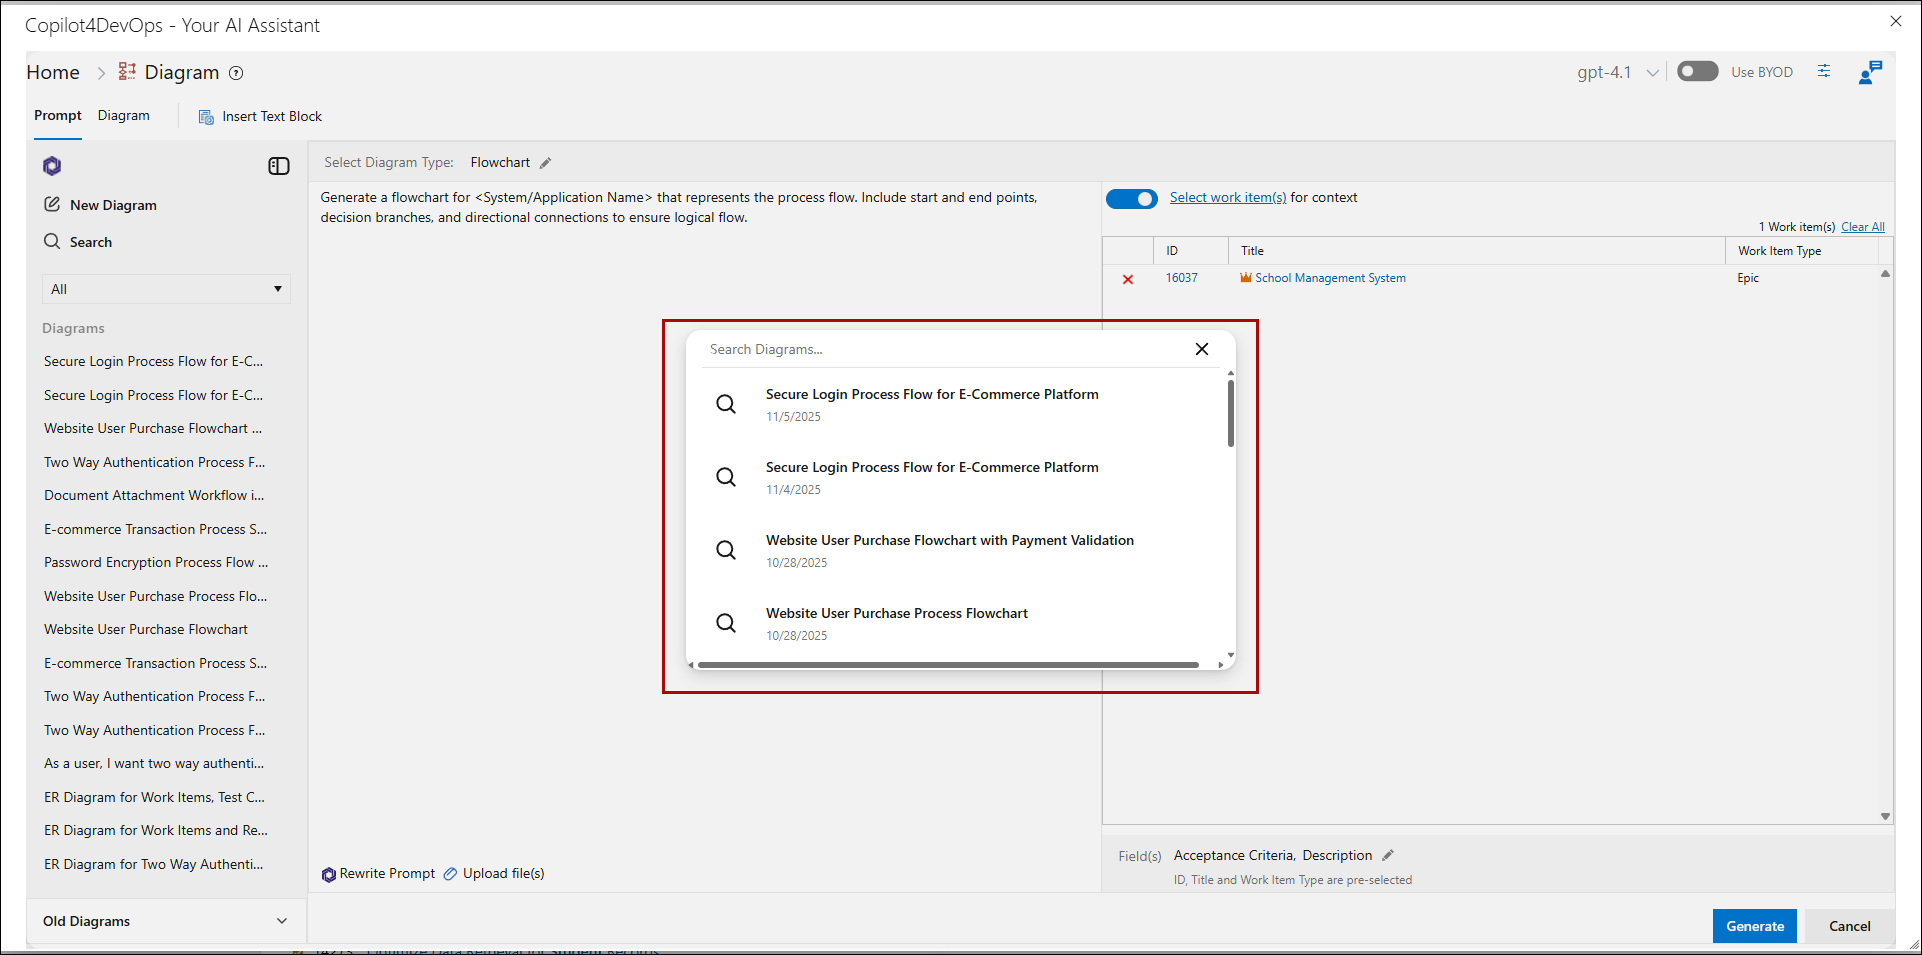
• With the search option, user can quickly search for a particular diagram. When the Search option is clicked, a Search Diagrams popup window appears.
• Diagrams that were generated 30 Days ago or more can be seen and accessed from the Old Diagrams option.
• By clicking on the (...) option just next to a diagram in the history panel, users have the option of renaming and deleting a diagram.

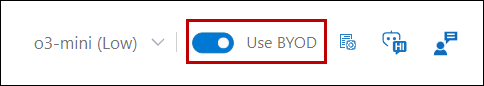
Enable 'Use BYOD'
Enable the Use BYOD toggle. This allows you to access data previously uploaded through the admin interface, which the AI will use to generate tailored outputs based on your uploaded data.