


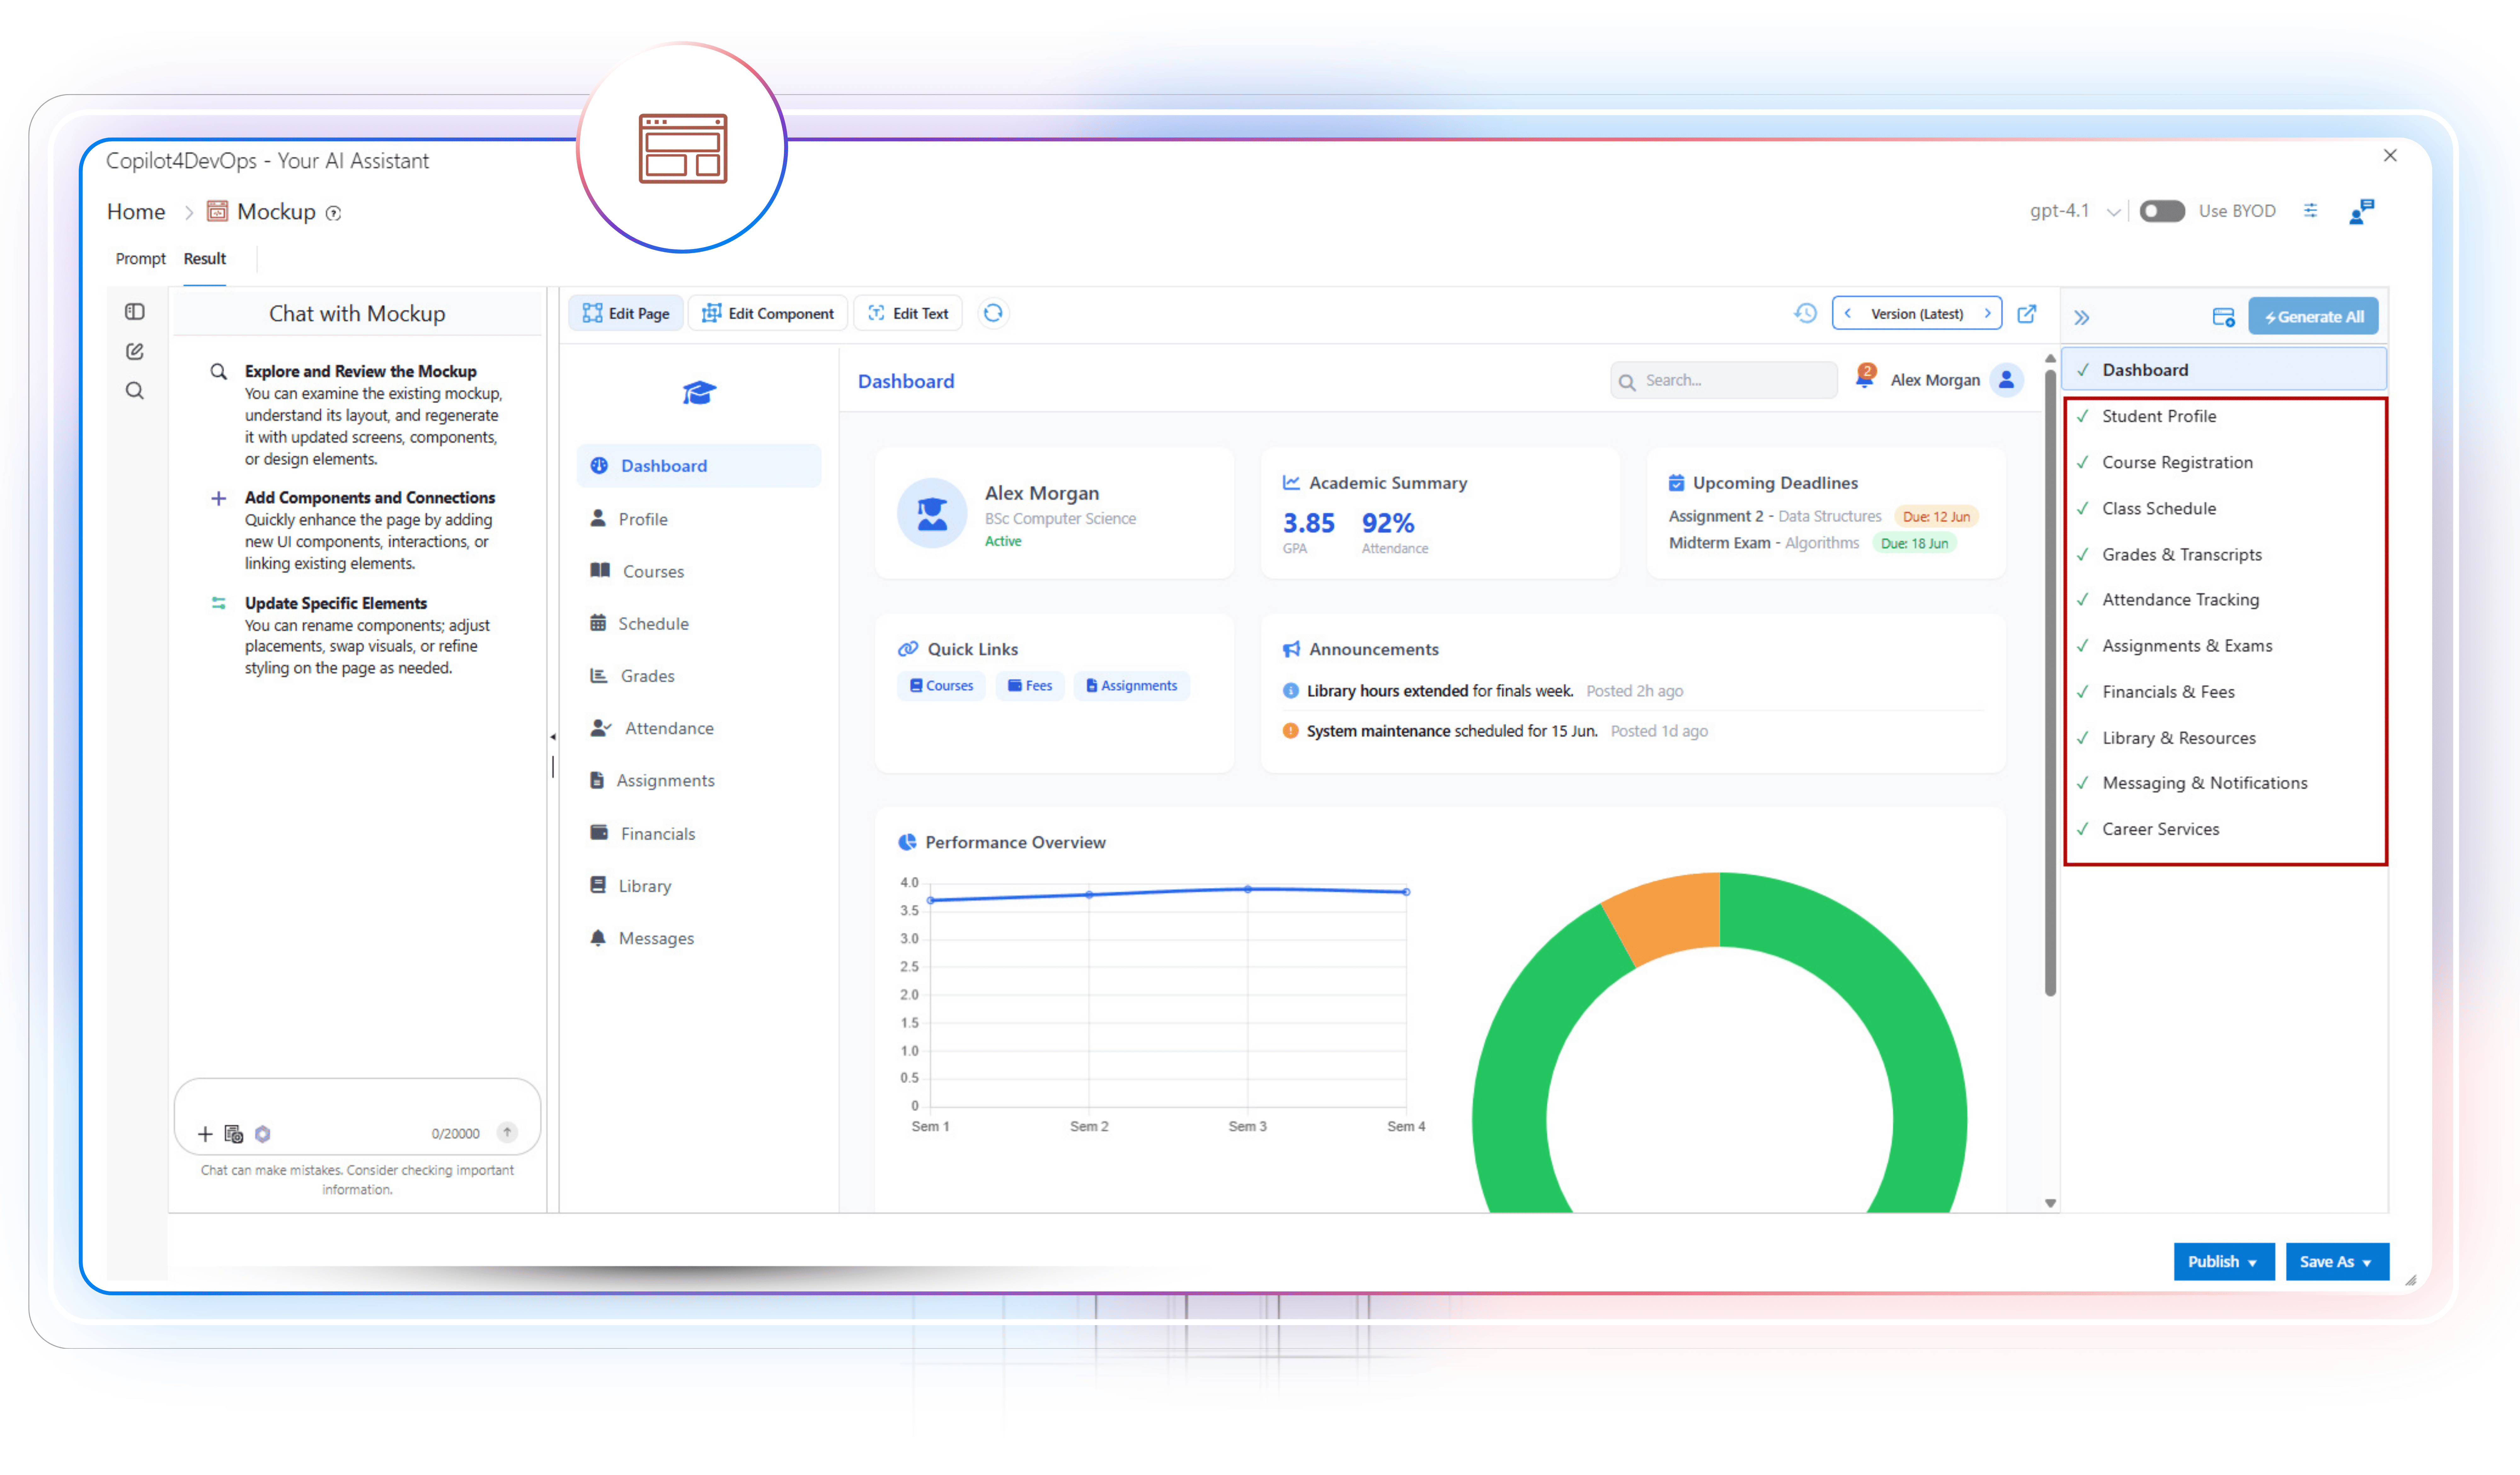
Mockup Tool
Turn ideas into interactive interfaces in minutes
Use AI to generate interactive and ready-to-review mockups directly from Azure work items. It helps in preparing early prototypes of products and reduces rework during design handoff.
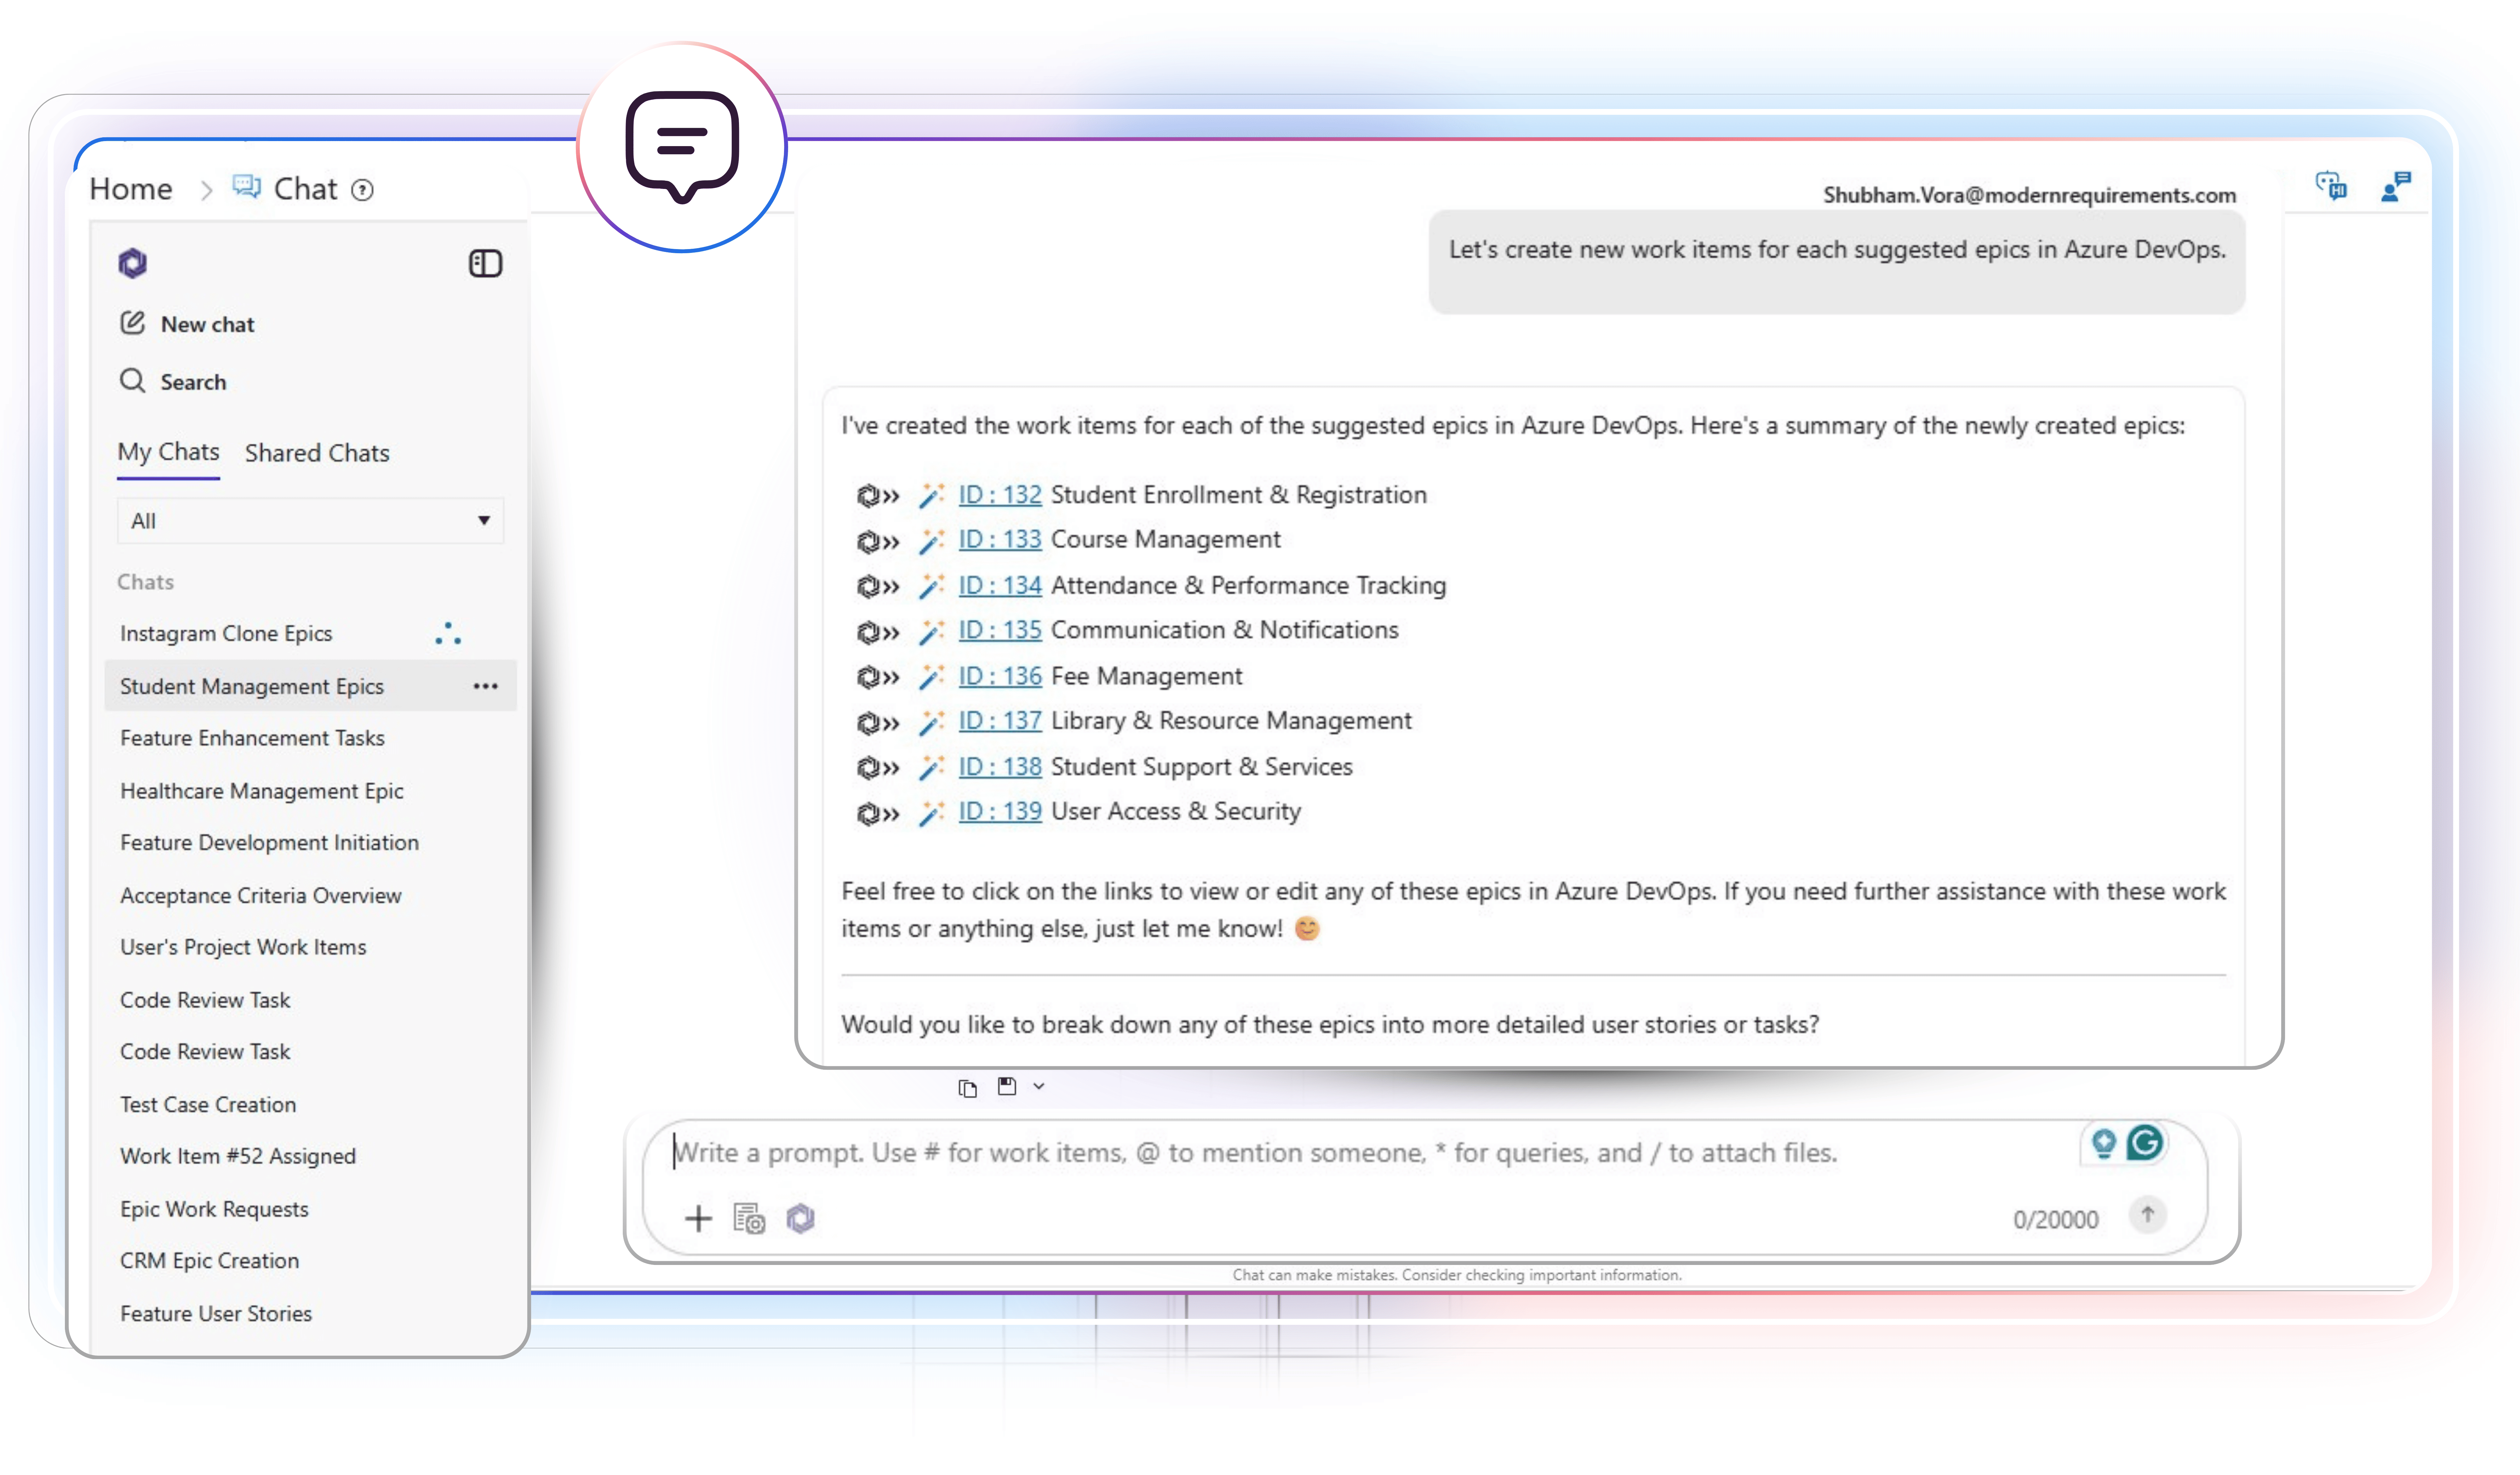
AI Chat
Interact with Azure work items using natural language
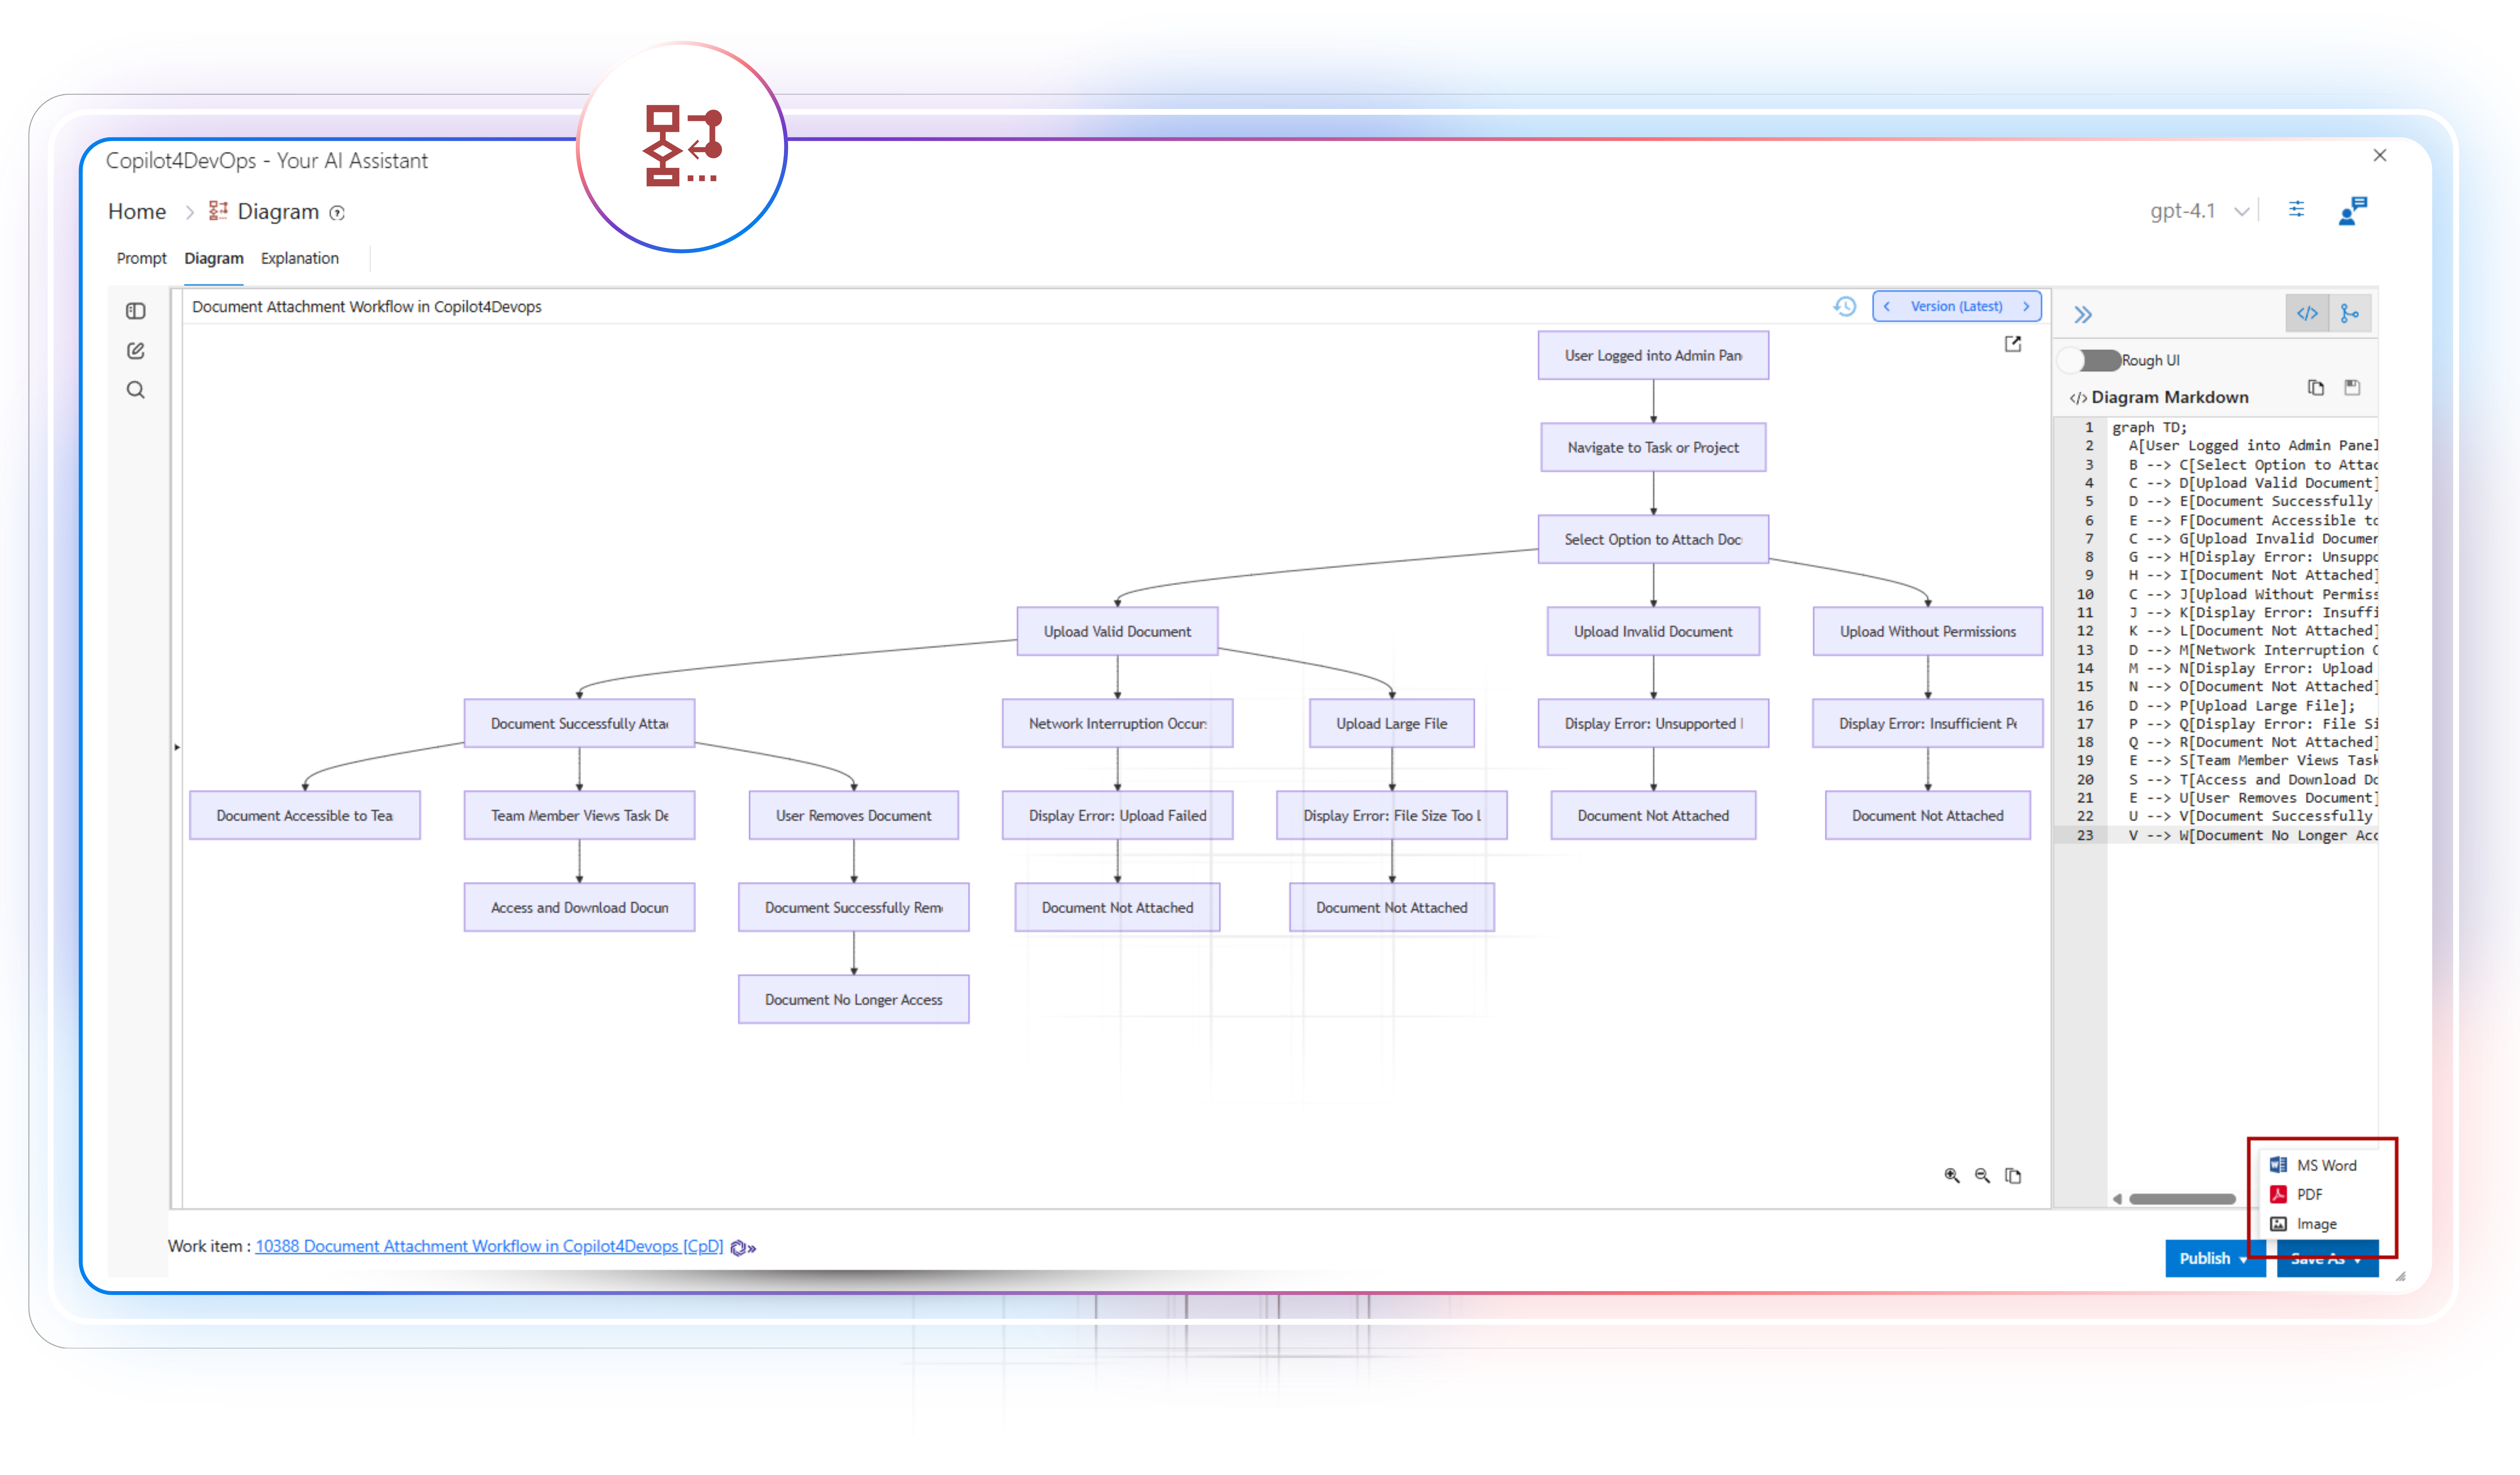
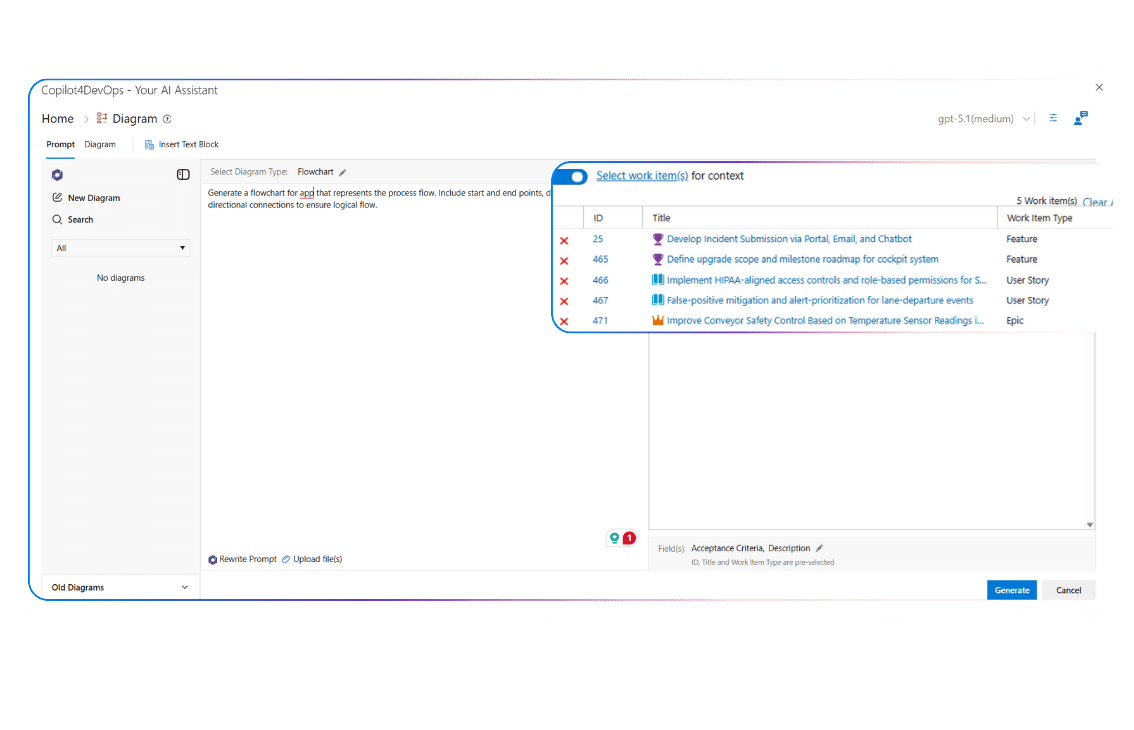
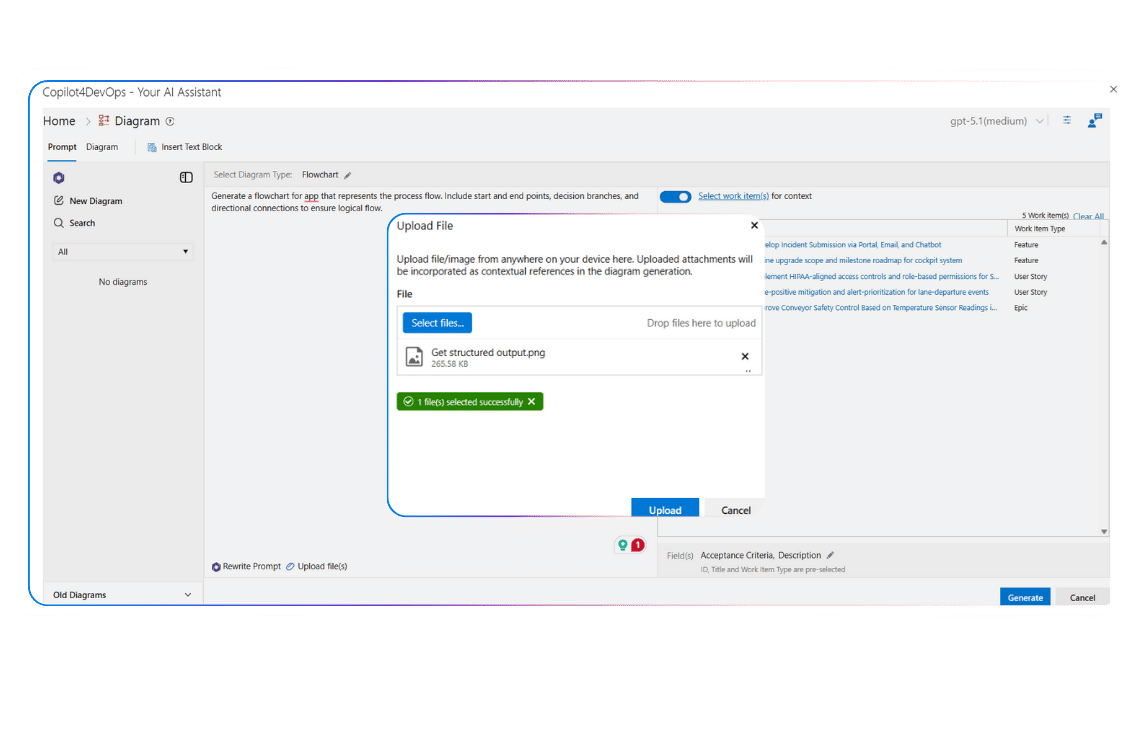
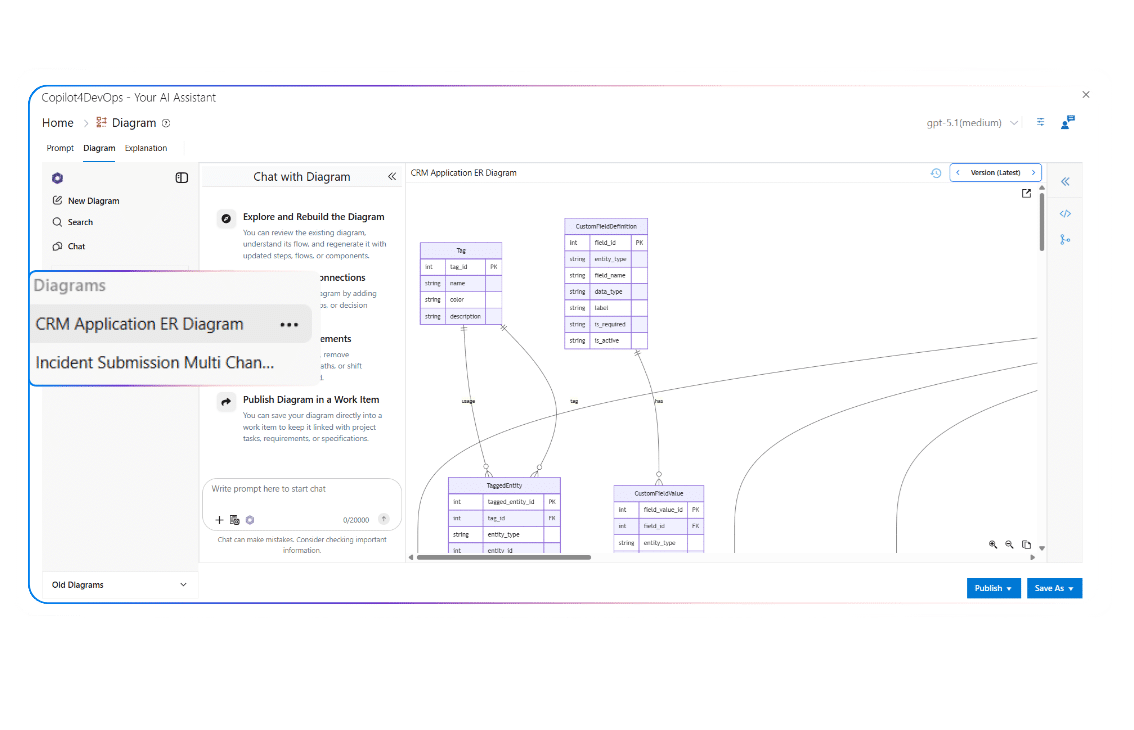
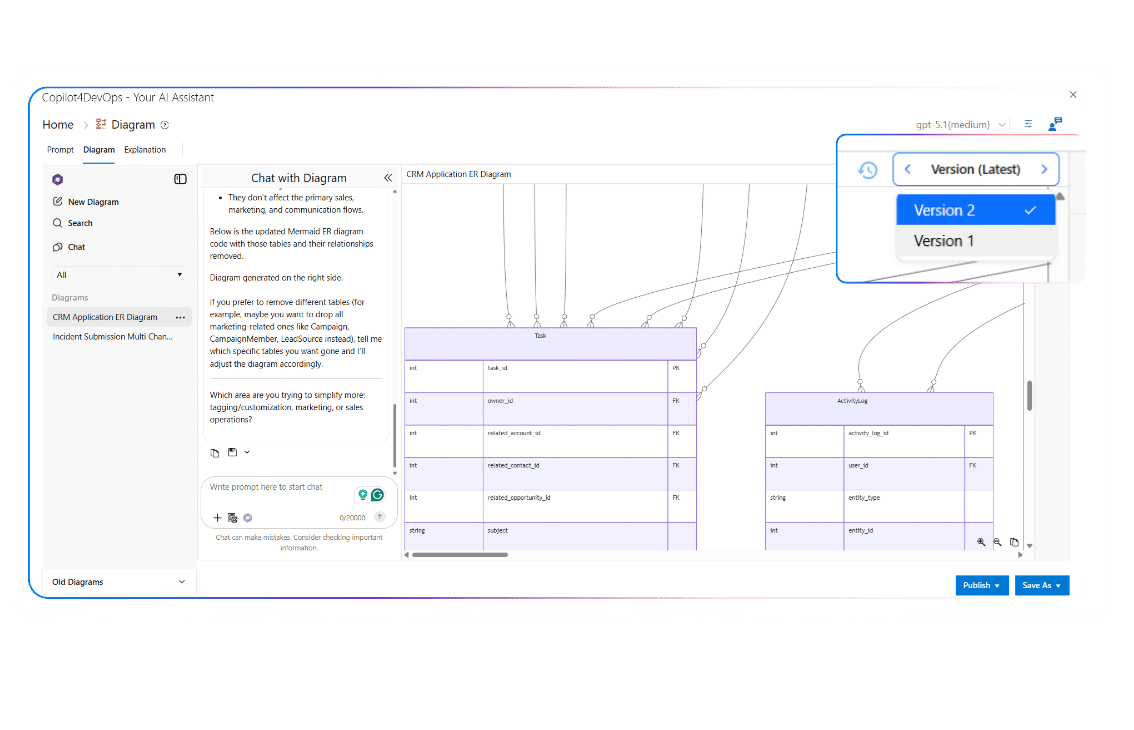
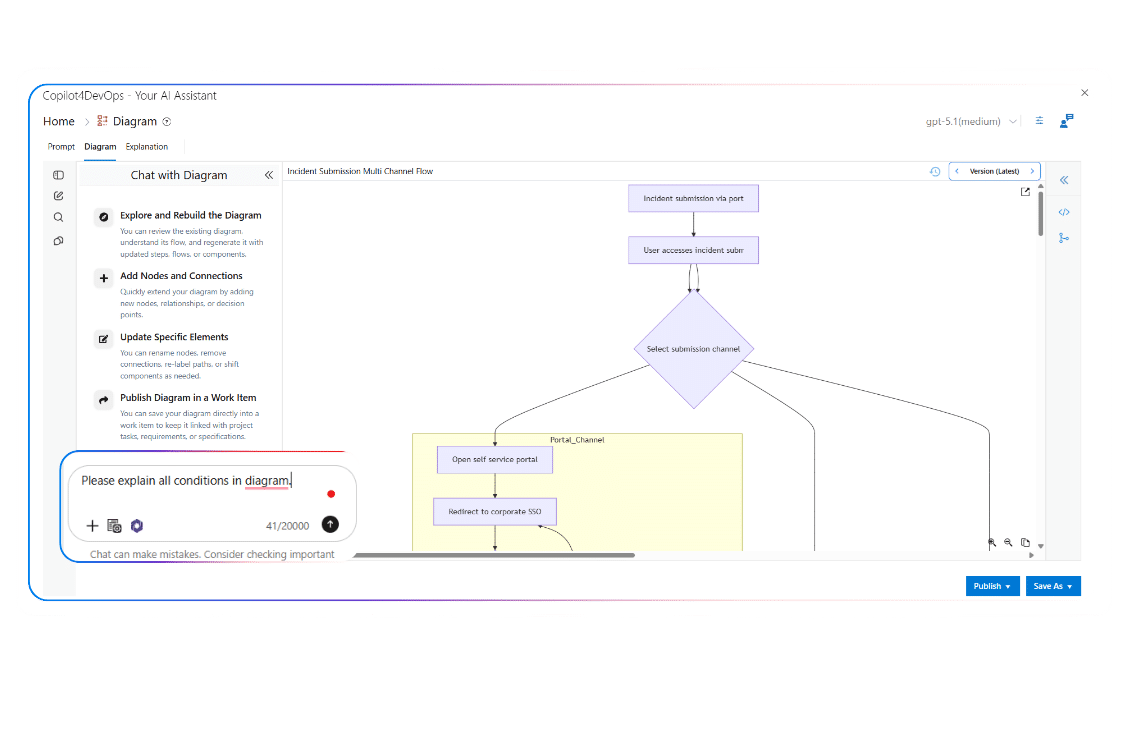
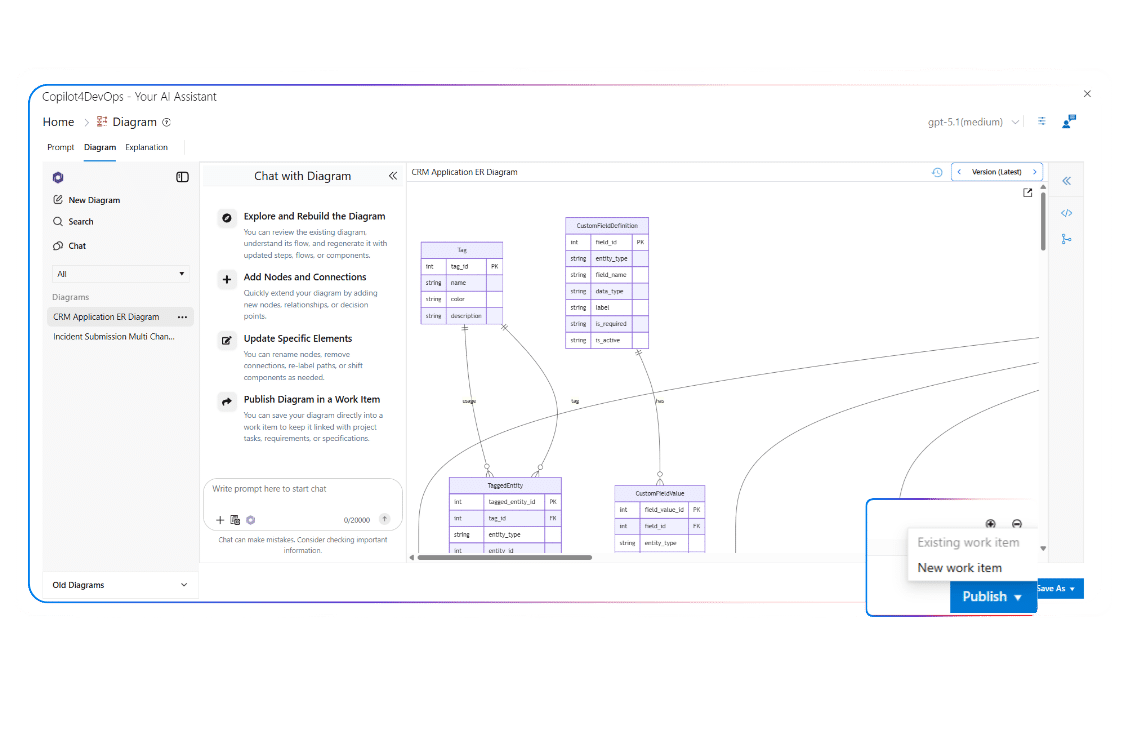
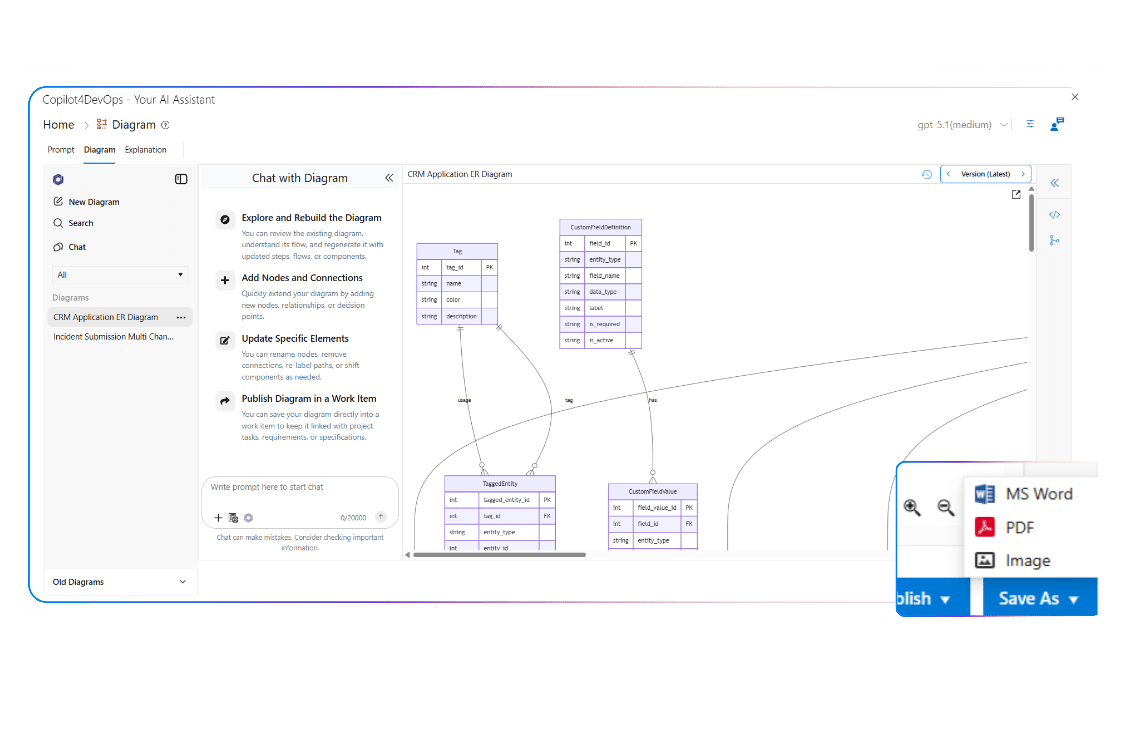
Type a prompt in plain English to list all required Azure work items. Then you may ask follow-up questions, create a workflow diagram based on multiple requirements, generate pseudocode or test scripts, or update work items using an AI.
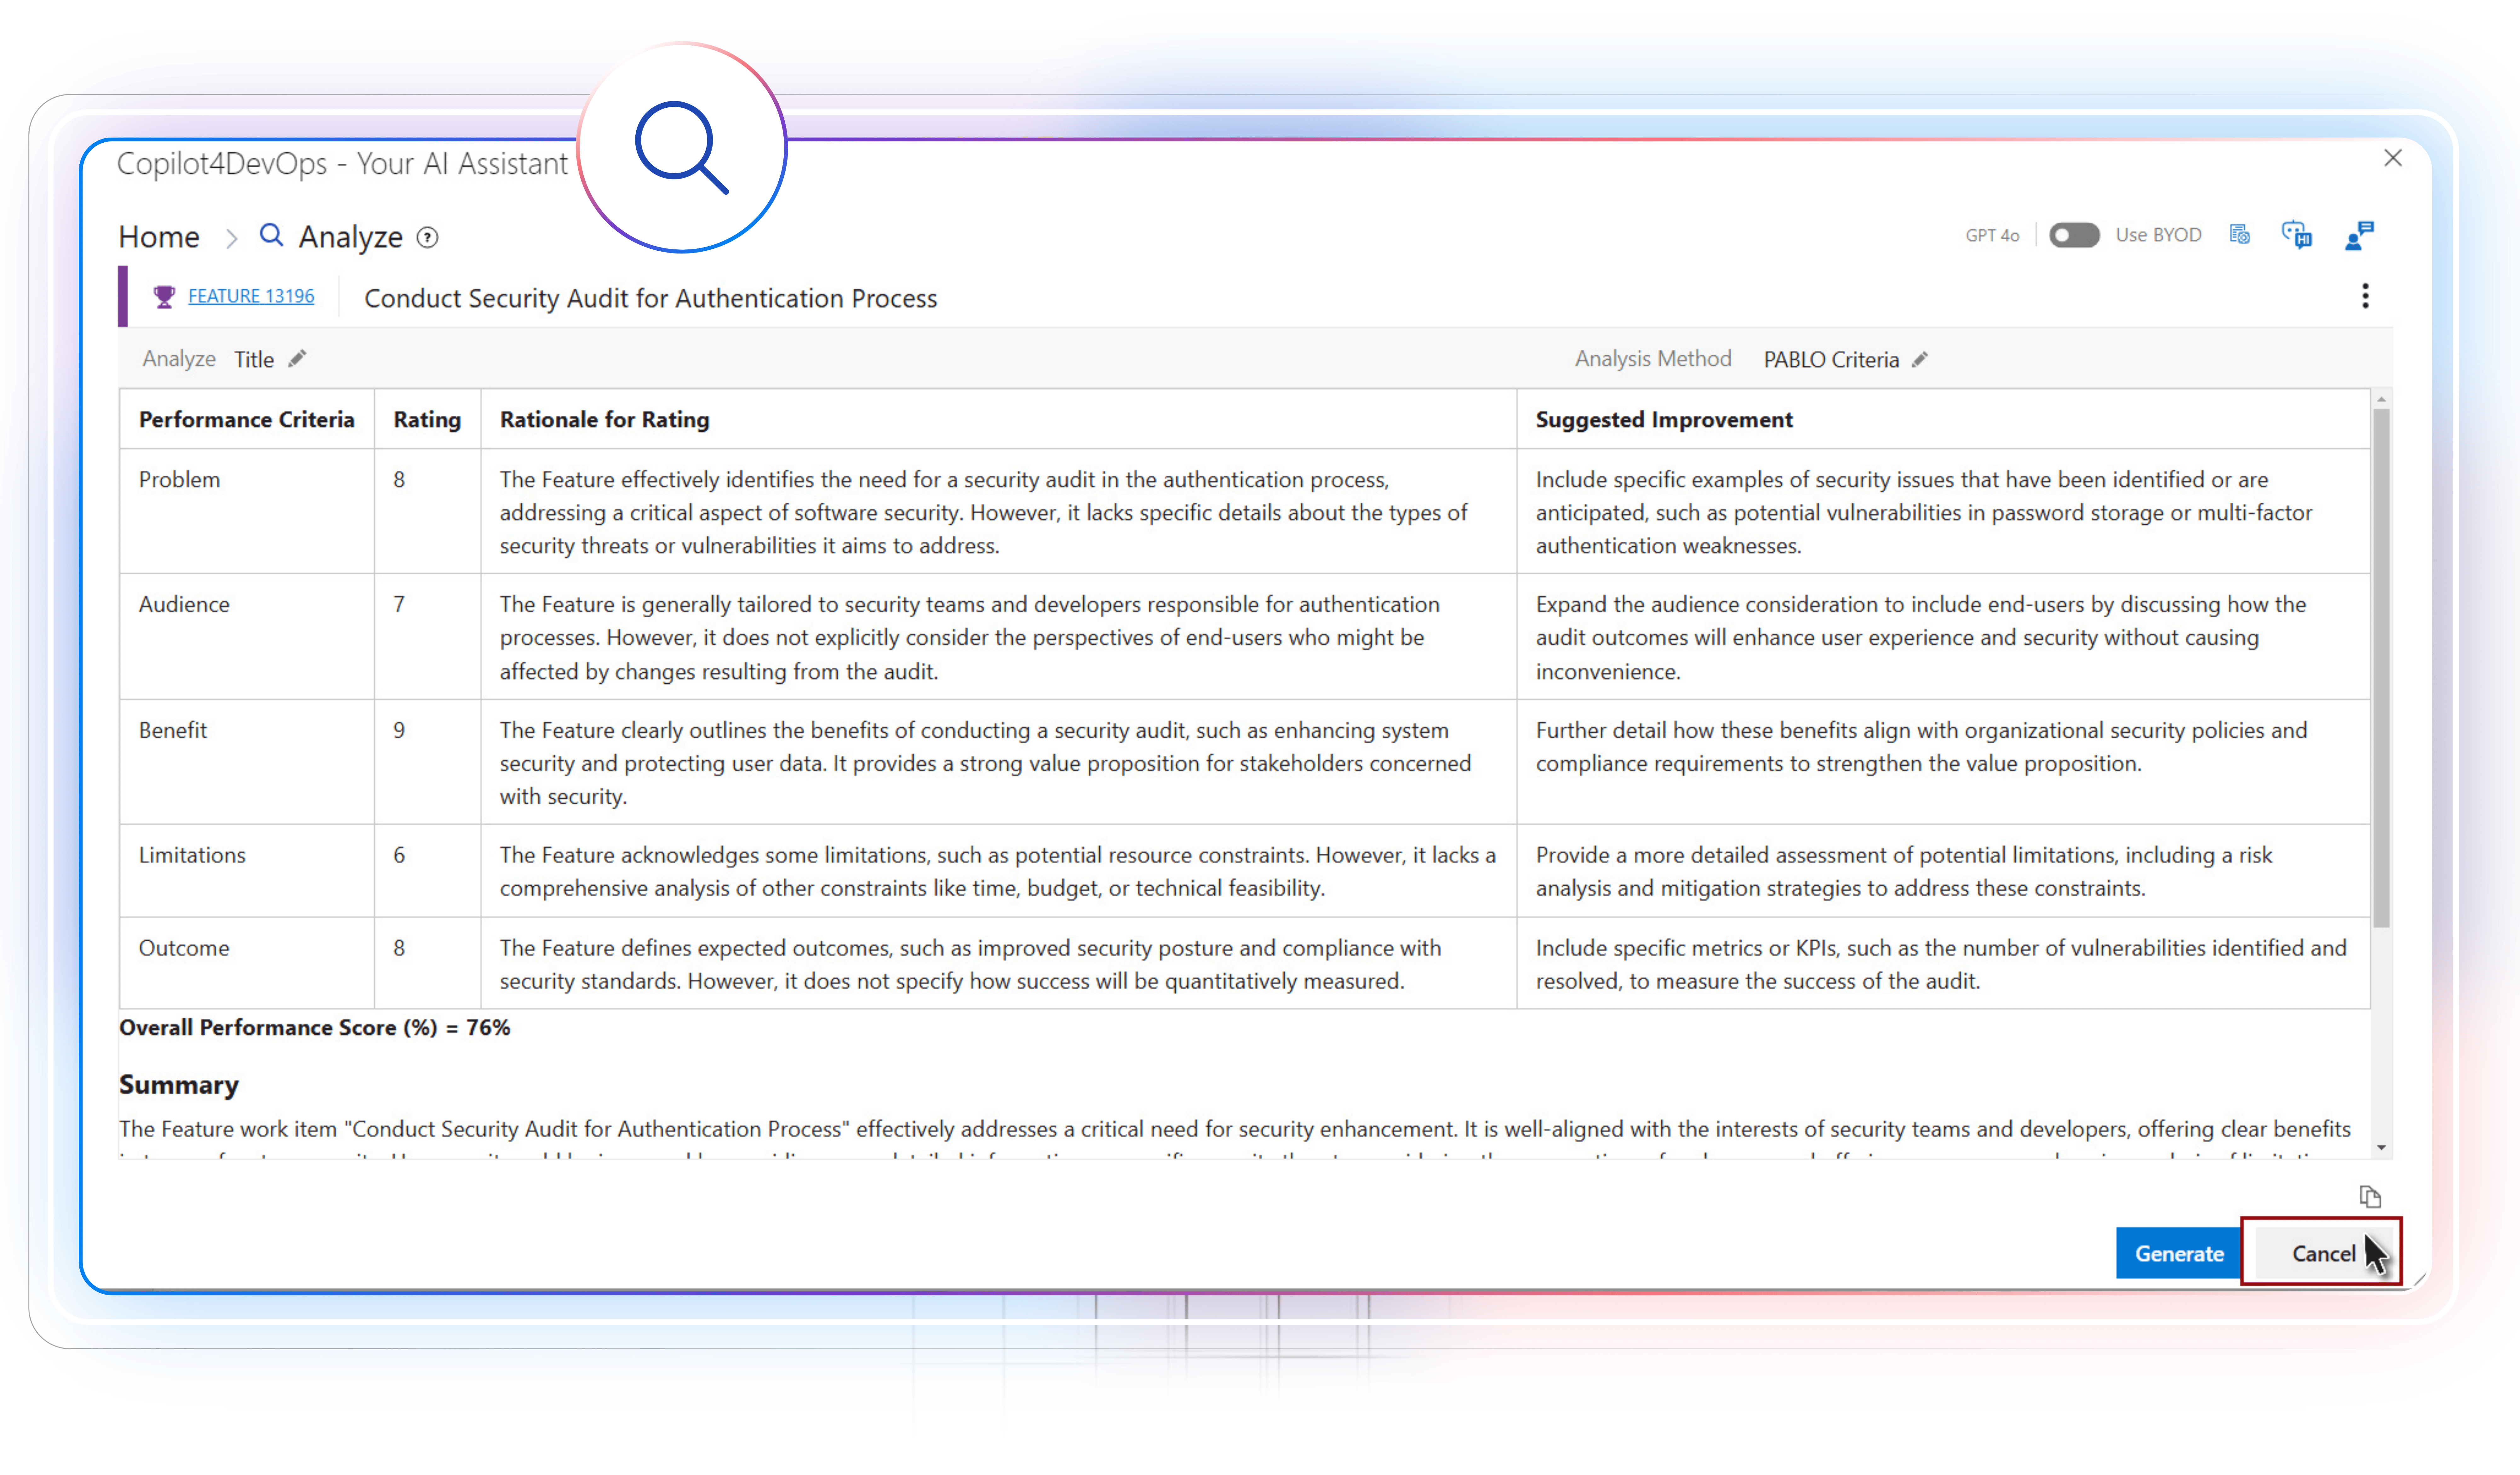
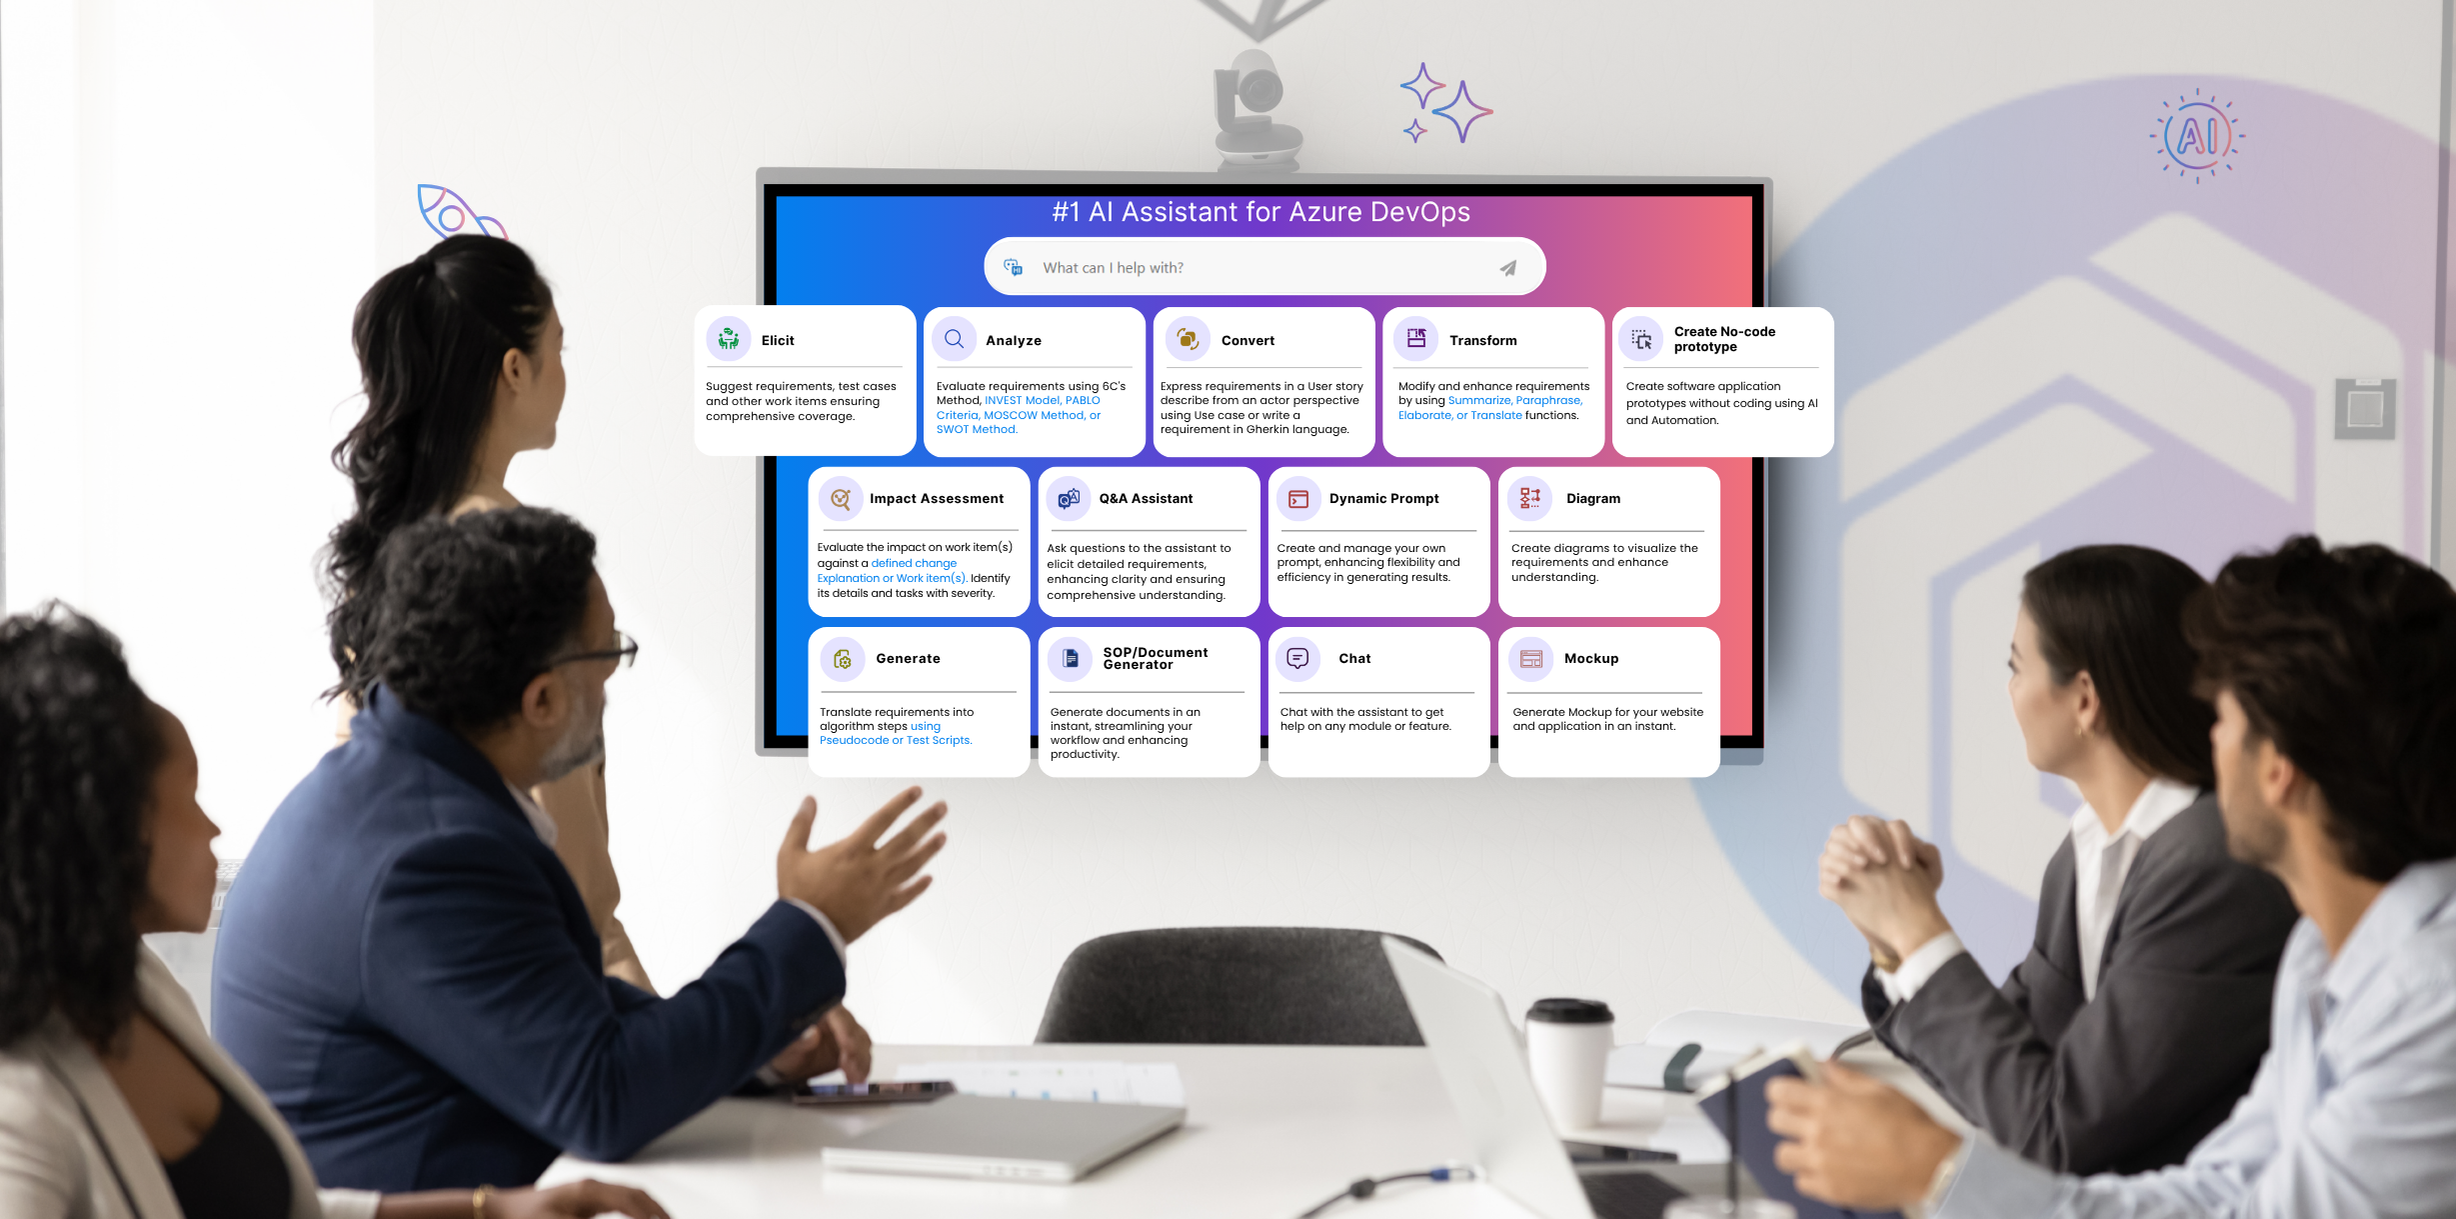
Analyze
AI for reviewing requirements
Analyze ADO work items against proven frameworks, such as MoSCoW, INVEST, PABLO Criteria, and the 6C’s method, using AI to find gaps and inconsistencies before any development starts.